GE 2010 Annual Report Download - page 47
Download and view the complete annual report
Please find page 47 of the 2010 GE annual report below. You can navigate through the pages in the report by either clicking on the pages listed below, or by using the keyword search tool below to find specific information within the annual report.-
 1
1 -
2
-
3
-
4
-
5
-
6
-
7
-
8
-
9
-
10
-
11
-
12
-
13
-
14
-
15
-
16
-
17
-
18
-
19
-
20
-
21
-
22
-
23
-
24
-
25
-
26
-
27
-
28
-
29
-
30
-
31
-
32
-
33
-
34
-
35
-
36
-
 37
37 -
 38
38 -
 39
39 -
 40
40 -
 41
41 -
 42
42 -
 43
43 -
 44
44 -
 45
45 -
 46
46 -
 47
47 -
 48
48 -
 49
49 -
 50
50 -
 51
51 -
 52
52 -
 53
53 -
 54
54 -
 55
55 -
 56
56 -
 57
57 -
58
-
59
-
60
-
61
-
62
-
63
-
64
-
65
-
66
-
67
-
68
-
69
-
70
-
71
-
72
-
73
-
74
-
75
-
76
-
77
-
78
-
79
-
80
-
81
-
82
-
83
-
84
-
85
-
86
-
87
-
88
-
89
-
90
-
91
-
92
-
93
-
94
-
95
-
96
-
97
-
98
-
99
-
100
-
101
-
102
-
103
-
104
-
105
-
106
-
107
-
108
-
109
-
110
-
111
-
112
-
113
-
114
-
115
-
116
-
117
-
118
-
119
-
120
-
121
-
122
-
123
-
124
-
125
-
126
-
127
-
128
-
129
-
130
-
131
-
132
-
133
-
134
-
135
-
136
-
137
-
138
-
139
-
140
 |
 |

management’s discussion and analsis
GE 2010 ANNUAL REPORT 45
GECS global revenues decreased 1% to $26.4 billion in 2010,
compared with $26.7 billion and $37.2 billion in 2009 and 2008,
respectively, primarily as a result of decreases in Europe. GECS
global revenues as a percentage of total GECS revenues were 52%
in 2010, compared with 51% and 53% in 2009 and 2008, respec-
tively. GECS global revenue decreased by 28% in 2009 from
$37.2 billion in 2008, primarily due to dispositions in Europe and
the Pacific Basin.
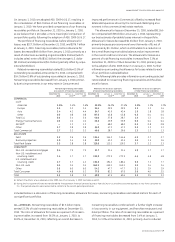
TOTAL ASSETS (CONTINUING OPERATIONS)
December 31 (In billions) 2010 2009
U.S. $387.3 $387.3
Europe 199.2 219.0
Pacific Basin 61.1 65.8
Americas 40.0 38.4
Other Global 58.3 56.3
Total $745.9 $766.8
Total assets of global operations on a continuing basis were
$358.6 billion in 2010, a decrease of $20.9 billion, or 6%, from 2009.
GECS global assets on a continuing basis of $279.6 billion at the
end of 2010 were 9% lower than at the end of 2009, reflecting
core declines in Europe and the Pacific Basin, primarily due to
portfolio run-off in various businesses at Consumer and lower
financing receivables and equipment leased to others at CLL.
Financial results of our global activities reported in U.S. dollars
are affected by currency exchange. We use a number of tech-
niques to manage the effects of currency exchange, including
selective borrowings in local currencies and selective hedging of
significant cross-currency transactions. Such principal currencies
are the pound sterling, the euro, the Japanese yen, the Canadian
dollar and the Australian dollar.
Environmental Matters
Our operations, like operations of other companies engaged
in similar businesses, involve the use, disposal and cleanup of
substances regulated under environmental protection laws.
We are involved in a sizeable number of remediation actions to
clean up hazardous wastes as required by federal and state
laws. Such statutes require that responsible parties fund reme-
diation actions regardless of fault, legality of original disposal or
ownership of a disposal site. Expenditures for site remediation
actions amounted to approximately $0.2 billion in 2010, $0.3 bil-
lion in 2009 and $0.2 billion in 2008. We presently expect that
such remediation actions will require average annual expendi-
tures of about $0.4 billion for each of the next two years.
As previously disclosed, in 2006, we entered into a consent
decree with the Environmental Protection Agency (EPA) to dredge
PCB-containing sediment from the upper Hudson River. The
consent decree provided that the dredging would be performed
in two phases. Phase 1 was completed in May through November
of 2009. Between Phase 1 and Phase 2 there was an intervening
peer review by an independent panel of national experts. The
panel evaluated the performance of Phase 1 dredging operations
with respect to Phase 1 Engineering Performance Standards
and recommended proposed changes to the standards. On
December 17, 2010, EPA issued its decisions setting forth the final
performance standards for Phase 2 of the dredging project,
incorporating aspects of the recommendations from the indepen-
dent peer review panel and from GE. In December 2010, we
agreed with EPA to perform Phase 2 of the project in accordance
with the final performance standards set by EPA. We have reviewed
EPA’s final performance standards for Phase 2 to assess the
potential scope and duration of Phase 2, as well as operational
and engineering changes that could be required. Based on this
review and our best professional engineering judgment, we
increased our reserve for the probable and estimable costs for
completing the Hudson River dredging project by $0.8 billion
in the fourth quarter of 2010.
Financial Resources and Liquidity
This discussion of financial resources and liquidity addresses
the Statement of Financial Position, Liquidity and Borrowings,
Debt and Derivative Instruments, Guarantees and Covenants,
the Consolidated Statement of Changes in Shareowners’
Equity, the Statement of Cash Flows, Contractual Obligations,
and Variable Interest Entities.
Overview of Financial Position
Major changes to our shareowners’ equity are discussed in the
Consolidated Statement of Changes in Shareowners’ Equity
section. In addition, other significant changes to balances in
our Statement of Financial Position follow.
Statement of Financial Position
Because GE and GECS share certain significant elements of their
Statements of Financial Position—property, plant and equipment
and borrowings, for example—the following discussion addresses
significant captions in the “consolidated” statement. Within the
following discussions, however, we distinguish between GE and
GECS activities in order to permit meaningful analysis of each
individual consolidating statement.
INVESTMENT SECURITIES comprise mainly investment grade debt
securities supporting obligations to annuitants and policy-
holders in our run-off insurance operations and holders of
guaranteed investment contracts (GICs) in Trinity (which ceased
issuing new investment contracts beginning in the first quarter
of 2010) and investment securities held at our global banks. The
fair value of investment securities decreased to $43.9 billion at
December 31, 2010, from $51.3 billion at December 31, 2009,
primarily driven by a decrease in retained interests as a result
of our adoption of FASB Accounting Standards Update (ASU)
2009-16 and ASU 2009-17, amendments to ASC 860, Transfers
and Servicing, and ASC 810, Consolidations, respectively
(ASU 2009-16 & 17), and maturities partially offset by improved
market conditions. Of the amount at December 31, 2010, we held
debt securities with an estimated fair value of $42.8 billion, which
included corporate debt securities, residential mortgage-backed
securities (RMBS) and commercial mortgage-backed securities
(CMBS) with estimated fair values of $25.4 billion, $2.8 billion and