GE 2010 Annual Report Download - page 48
Download and view the complete annual report
Please find page 48 of the 2010 GE annual report below. You can navigate through the pages in the report by either clicking on the pages listed below, or by using the keyword search tool below to find specific information within the annual report.-
 1
1 -
2
-
3
-
4
-
5
-
6
-
7
-
8
-
9
-
10
-
11
-
12
-
13
-
14
-
15
-
16
-
17
-
18
-
19
-
20
-
21
-
22
-
23
-
24
-
25
-
26
-
27
-
28
-
29
-
30
-
31
-
32
-
33
-
34
-
35
-
36
-
37
-
 38
38 -
 39
39 -
 40
40 -
 41
41 -
 42
42 -
 43
43 -
 44
44 -
 45
45 -
 46
46 -
 47
47 -
 48
48 -
 49
49 -
 50
50 -
 51
51 -
 52
52 -
 53
53 -
 54
54 -
 55
55 -
 56
56 -
 57
57 -
 58
58 -
59
-
60
-
61
-
62
-
63
-
64
-
65
-
66
-
67
-
68
-
69
-
70
-
71
-
72
-
73
-
74
-
75
-
76
-
77
-
78
-
79
-
80
-
81
-
82
-
83
-
84
-
85
-
86
-
87
-
88
-
89
-
90
-
91
-
92
-
93
-
94
-
95
-
96
-
97
-
98
-
99
-
100
-
101
-
102
-
103
-
104
-
105
-
106
-
107
-
108
-
109
-
110
-
111
-
112
-
113
-
114
-
115
-
116
-
117
-
118
-
119
-
120
-
121
-
122
-
123
-
124
-
125
-
126
-
127
-
128
-
129
-
130
-
131
-
132
-
133
-
134
-
135
-
136
-
137
-
138
-
139
-
140
 |
 |
management’s discussion and analsis
46 GE 2010 ANNUAL REPORT
$2.9 billion, respectively. Unrealized losses on debt securities
were $1.4 billion and $2.6 billion at December 31, 2010 and
December 31, 2009, respectively. This amount included unreal-
ized losses on corporate debt securities, RMBS and CMBS of
$0.4 billion, $0.4 billion and $0.1 billion, respectively, at
December 31, 2010, as compared with $0.8 billion, $0.8 billion
and $0.4 billion, respectively, at December 31, 2009.
We regularly review investment securities for impairment
using both qualitative and quantitative criteria. We presently do
not intend to sell our debt securities and believe that it is not more
likely than not that we will be required to sell these securities that
are in an unrealized loss position before recovery of our amortized
cost. We believe that the unrealized loss associated with our
equity securities will be recovered within the foreseeable future.
Our RMBS portfolio is collateralized primarily by pools of indi-
vidual, direct mortgage loans (a majority of which were originated
in 2006 and 2005), not other structured products such as collater-
alized debt obligations. Substantially all of our RMBS securities are
in a senior position in the capital structure of the deals and 65% are
agency bonds or insured by Monoline insurers (on which we con-
tinue to place reliance). Of our total RMBS portfolio at December 31,
2010 and December 31, 2009, approximately $0.7 billion and
$0.9 billion, respectively, relate to residential subprime credit,
primarily supporting our guaranteed investment contracts. A
majority of exposure to residential subprime credit related to
investment securities backed by mortgage loans originated in
2006 and 2005. Substantially all of the subprime RMBS were invest-
ment grade at the time of purchase and approximately 72% have
been subsequently downgraded to below investment grade.
Our CMBS portfolio is collateralized by both diversified pools of
mortgages that were originated for securitization (conduit CMBS)
and pools of large loans backed by high-quality properties (large
loan CMBS), a majority of which were originated in 2007 and 2006.
Substantially all of the securities in our CMBS portfolio have
investment grade credit ratings and the vast majority of the
securities are in a senior position in the capital structure.
Our asset-backed securities (ABS) portfolio is collateralized by
a variety of diversified pools of assets such as student loans and
credit cards, as well as large senior secured loans of high-quality,
middle-market companies in a variety of industries. The vast
majority of our ABS securities are in a senior position in the capital
structure of the deals. In addition, substantially all of the securities
that are below investment grade are in an unrealized gain position.
For ABS, including RMBS, we estimate the portion of loss
attributable to credit using a discounted cash flow model that
considers estimates of cash flows generated from the underlying
collateral. Estimates of cash flows consider internal credit risk,
interest rate and prepayment assumptions that incorporate
management’s best estimate of key assumptions, including
default rates, loss severity and prepayment rates. For CMBS, we
estimate the portion of loss attributable to credit by evaluating
potential losses on each of the underlying loans in the security.
Collateral cash flows are considered in the context of our position
in the capital structure of the deals. Assumptions can vary widely
depending upon the collateral type, geographic concentrations
and vintage.
If there has been an adverse change in cash flows for RMBS,
management considers credit enhancements such as Monoline
insurance (which are features of a specific security). In evaluating
the overall creditworthiness of the Monoline insurer (Monoline),
we use an analysis that is similar to the approach we use for cor-
porate bonds, including an evaluation of the sufficiency of the
Monoline’s cash reserves and capital, ratings activity, whether
the Monoline is in default or default appears imminent, and the
potential for intervention by an insurance or other regulator.
Monolines provide credit enhancement for certain of our
investment securities, primarily RMBS and municipal securities.
The credit enhancement is a feature of each specific security that
guarantees the payment of all contractual cash flows, and is not
purchased separately by GE. The Monoline industry continues to
experience financial stress from increasing delinquencies and
defaults on the individual loans underlying insured securities. We
continue to rely on Monolines with adequate capital and claims
paying resources. We have reduced our reliance on Monolines
that do not have adequate capital or have experienced regulator
intervention. At December 31, 2010, our investment securities
insured by Monolines on which we continue to place reliance were
$1.7 billion, including $0.3 billion of our $0.7 billion investment in
subprime RMBS. At December 31, 2010, the unrealized loss associ-
ated with securities subject to Monoline credit enhancement for
which there is an expected credit loss was $0.3 billion.
Total pre-tax, other-than-temporary impairment losses during
2010 were $0.5 billion, of which $0.3 billion was recognized in
earnings and primarily relates to credit losses on RMBS, non-U.S.
government securities, non-U.S. corporate securities and equity
securities, and $0.2 billion primarily relates to non-credit related
losses on RMBS and is included within accumulated other com-
prehensive income.
Our qualitative review attempts to identify issuers’ securities
that are “at-risk” of other-than-temporary impairment, that is, for
securities that we do not intend to sell and it is not more likely
than not that we will be required to sell before recovery of our
amortized cost, whether there is a possibility of credit loss that
would result in an other-than-temporary impairment recognition
in the following 12 months. Securities we have identified as “at-
risk” primarily relate to investments in RMBS securities and
non-U.S. corporate debt securities across a broad range of indus-
tries. The amount of associated unrealized loss on these securities
at December 31, 2010, is $0.4 billion. Credit losses that would be
recognized in earnings are calculated when we determine the
security to be other-than-temporarily impaired. Uncertainty in
the capital markets may cause increased levels of other-than-
temporary impairments.
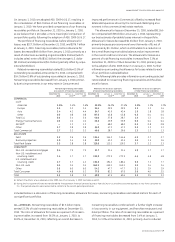
At December 31, 2010, unrealized losses on investment securi-
ties totaled $1.4 billion, including $1.2 billion aged 12 months or
longer, compared with unrealized losses of $2.6 billion, including
$2.3 billion aged 12 months or longer, at December 31, 2009. Of
the amount aged 12 months or longer at December 31, 2010,
more than 70% of our debt securities were considered to be
investment grade by the major rating agencies. In addition, of the
amount aged 12 months or longer, $0.7 billion and $0.3 billion
related to structured securities (mortgage-backed, asset-backed