GE 2010 Annual Report Download - page 110
Download and view the complete annual report
Please find page 110 of the 2010 GE annual report below. You can navigate through the pages in the report by either clicking on the pages listed below, or by using the keyword search tool below to find specific information within the annual report.-
 1
1 -
2
-
3
-
4
-
5
-
6
-
7
-
8
-
9
-
10
-
11
-
12
-
13
-
14
-
15
-
16
-
17
-
18
-
19
-
20
-
21
-
22
-
23
-
24
-
25
-
26
-
27
-
28
-
29
-
30
-
31
-
32
-
33
-
34
-
35
-
36
-
37
-
38
-
39
-
40
-
41
-
42
-
43
-
44
-
45
-
46
-
47
-
48
-
49
-
50
-
51
-
52
-
53
-
54
-
55
-
56
-
57
-
58
-
59
-
60
-
61
-
62
-
63
-
64
-
65
-
66
-
67
-
68
-
69
-
70
-
71
-
72
-
73
-
74
-
75
-
76
-
77
-
78
-
79
-
80
-
81
-
82
-
83
-
84
-
85
-
86
-
87
-
88
-
89
-
90
-
91
-
92
-
93
-
94
-
95
-
96
-
97
-
98
-
99
-
 100
100 -
 101
101 -
 102
102 -
 103
103 -
 104
104 -
 105
105 -
 106
106 -
 107
107 -
 108
108 -
 109
109 -
 110
110 -
 111
111 -
 112
112 -
 113
113 -
 114
114 -
 115
115 -
 116
116 -
 117
117 -
 118
118 -
 119
119 -
 120
120 -
121
-
122
-
123
-
124
-
125
-
126
-
127
-
128
-
129
-
130
-
131
-
132
-
133
-
134
-
135
-
136
-
137
-
138
-
139
-
140
 |
 |

108 GE 2010 ANNUAL REPORT
Note 20.
Earnings Per Share Information
2010 2009 2008
(In millions; per-share amounts in dollars) Diluted Basic Diluted Basic Diluted Basic
AMOUNTS ATTRIBUTABLE TO THE COMPANY:
CONSOLIDATED
Earnings from continuing operations for per-share calculation
(a) (b) $12,599 $12,598 $10,914 $10,913 $18,028 $18,027
Preferred stock dividends declared (300) (300) (300) (300) (75) (75)
Earnings from continuing operations attributable to common
shareowners for per-share calculation
(a)(b) 12,299 12,298 10,614 10,613 17,953 17,952
Earnings (loss) from discontinued operations for per-share calculation
(a) (b) (975) (975) 83 82 (617) (617)
Net earnings attributable to common shareowners for
per-share calculation
(a) (b) $11,322 $11,322 $10,695 $10,694 $17,336 $17,335
AVERAGE EQUIVALENT SHARES
Shares of GE common stock outstanding 10,661 10,661 10,614 10,614 10,080 10,080
Employee compensation-related shares, including stock options 17 — 1 — 18 —
Total average equivalent shares 10,678 10,661 10,615 10,614 10,098 10,080
PER-SHARE AMOUNTS
Earnings from continuing operations $ 1.15 $ 1.15 $ 1.00 $ 1.00 $ 1.78 $ 1.78
Earnings (loss) from discontinued operations (0.09) (0.09) 0.01 0.01 (0.06) (0.06)
Net earnings 1.06 1.06 1.01 1.01 1.72 1.72
Effective January 1, 2009, our unvested restricted stock unit awards that contain non-forfeitable rights to dividends or dividend equivalents are considered participating securities
and, therefore, are included in the computation of earnings per share pursuant to the two-class method. Application of this treatment had an insignificant effect.
(a) Included an insignificant amount of dividend equivalents in each of the three years presented.
(b) Included an insignificant amount related to accretion of redeemable securities in 2010 and 2009.
For the years ended December 31, 2010, 2009 and 2008, there
were approximately 344 million, 328 million and 204 million,
respectively, of outstanding stock awards that were not included
in the computation of diluted earnings per share because their
effect was antidilutive.
Earnings-per-share amounts are computed independently
for earnings from continuing operations, earnings (loss) from
discontinued operations and net earnings. As a result, the sum
of per-share amounts from continuing operations and discontin-
ued operations may not equal the total per-share amounts for
net earnings.
GE’s selling, general and administrative expenses totaled
$16,341 million in 2010, $14,842 million in 2009 and $14,401 mil-
lion in 2008. The increase in 2010 is primarily due to increased
selling expenses to support global growth and higher pension
costs, partially offset by lower restructuring and other charges.
Our Technology Infrastructure and Energy Infrastructure
segments enter into collaborative arrangements with manufac-
turers and suppliers of components used to build and maintain
certain engines, aeroderivatives and turbines, under which GE
Note 21.
Fair Value Measurements
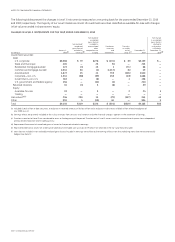
For a description of how we estimate fair value, see Note 1.
The following tables present our assets and liabilities mea-
sured at fair value on a recurring basis. Included in the tables are
investment securities of $27,141 million and $25,729 million at
December 31, 2010 and 2009, respectively, primarily supporting
obligations to annuitants and policyholders in our run-off
insurance operations, and $5,706 million and $6,629 million at
December 31, 2010 and 2009, respectively, supporting obligations
to holders of GICs in Trinity (which ceased issuing new investment
contracts beginning in the first quarter of 2010), and investment
securities held at our global banks. Such securities are mainly
investment grade.
and these participants share in risks and rewards of these prod-
uct programs. Under these arrangements, participation fees
earned and recorded as other income totaled $4 million, $1 mil-
lion and $394 million for the years 2010, 2009 and 2008,
respectively. Payments to participants are recorded as costs of
services sold ($563 million, $504 million and $423 million for the
years 2010, 2009 and 2008, respectively) or as cost of goods sold
($1,751 million, $1,731 million and $1,882 million for the years
2010, 2009 and 2008, respectively).