GE 2010 Annual Report Download - page 112
Download and view the complete annual report
Please find page 112 of the 2010 GE annual report below. You can navigate through the pages in the report by either clicking on the pages listed below, or by using the keyword search tool below to find specific information within the annual report.-
 1
1 -
2
-
3
-
4
-
5
-
6
-
7
-
8
-
9
-
10
-
11
-
12
-
13
-
14
-
15
-
16
-
17
-
18
-
19
-
20
-
21
-
22
-
23
-
24
-
25
-
26
-
27
-
28
-
29
-
30
-
31
-
32
-
33
-
34
-
35
-
36
-
37
-
38
-
39
-
40
-
41
-
42
-
43
-
44
-
45
-
46
-
47
-
48
-
49
-
50
-
51
-
52
-
53
-
54
-
55
-
56
-
57
-
58
-
59
-
60
-
61
-
62
-
63
-
64
-
65
-
66
-
67
-
68
-
69
-
70
-
71
-
72
-
73
-
74
-
75
-
76
-
77
-
78
-
79
-
80
-
81
-
82
-
83
-
84
-
85
-
86
-
87
-
88
-
89
-
90
-
91
-
92
-
93
-
94
-
95
-
96
-
97
-
98
-
99
-
100
-
101
-
 102
102 -
 103
103 -
 104
104 -
 105
105 -
 106
106 -
 107
107 -
 108
108 -
 109
109 -
 110
110 -
 111
111 -
 112
112 -
 113
113 -
 114
114 -
 115
115 -
 116
116 -
 117
117 -
 118
118 -
 119
119 -
 120
120 -
 121
121 -
 122
122 -
123
-
124
-
125
-
126
-
127
-
128
-
129
-
130
-
131
-
132
-
133
-
134
-
135
-
136
-
137
-
138
-
139
-
140
 |
 |

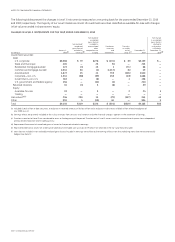
110 GE 2010 ANNUAL REPORT
The following tables present the changes in Level 3 instruments measured on a recurring basis for the years ended December 31, 2010
and 2009, respectively. The majority of our Level 3 balances consist of investment securities classified as available-for-sale with changes
in fair value recorded in shareowners’ equity.
CHANGES IN LEVEL 3 INSTRUMENTS FOR THE YEAR ENDED DECEMBER 31, 2010
Net realized/ Net change
unrealized in unrealized
gains (losses) gains (losses)
Net realized/ included in relating to
unrealized accumulated Purchases, Transfers instruments
gains (losses) other issuances in and/or still held at
January 1, included in comprehensive and out of December 31, December 31,
(In millions) 2010 (a) earnings (b) income settlements Level 3 (c) 2010 2010 (d)
Investment securities
Debt
U.S. corporate $3,068 $ 79 $276 $ (215) $ (9) $3,199 $ —
State and municipal 205 — 25 (5) — 225 —
Residential mortgage-backed 123 (1) 13 2 (71) 66 —
Commercial mortgage-backed 1,041 30 (2) (1,017) (3) 49 —
Asset-backed 1,872 25 14 733 (104) 2,540 —
Corporate—non-U.S. 1,331 (38) (39) 250 (18) 1,486 —
Government—non-U.S. 163 — (8) — 1 156 —
U.S. government and federal agency 256 — (44) (2) — 210 —
Retained interests 45 (1) 3 (8) — 39 —
Equity
Available-for-sale 19 — 3 — 2 24 1
Trading — — — — — — —
Derivatives(e)(f) 236 220 15 (79) (127) 265 41
Other 891 5 (30) 40 — 906 3
Total $9,250 $319 $226 $ (301) $(329) $9,165
$45
(a) Included $1,015 million in debt securities, a reduction in retained interests of $8,782 million and a reduction in derivatives of $365 million related to adoption of
ASU 2009-16 & 17.
(b) Earnings effects are primarily included in the “GECS revenues from services” and “Interest and other financial charges” captions in the Statement of Earnings.
(c) Transfers in and out of Level 3 are considered to occur at the beginning of the period. Transfers out of Level 3 were a result of increased use of quotes from independent
pricing vendors based on recent trading activity.
(d) Represented the amount of unrealized gains or losses for the period included in earnings.
(e) Represented derivative assets net of derivative liabilities and included cash accruals of $9 million not reflected in the fair value hierarchy table.
(f) Gains (losses) included in net realized/unrealized gains (losses) included in earnings were offset by the earnings effects from the underlying items that were economically
hedged. See Note 22.