GE 2010 Annual Report Download - page 131
Download and view the complete annual report
Please find page 131 of the 2010 GE annual report below. You can navigate through the pages in the report by either clicking on the pages listed below, or by using the keyword search tool below to find specific information within the annual report.-
 1
1 -
2
-
3
-
4
-
5
-
6
-
7
-
8
-
9
-
10
-
11
-
12
-
13
-
14
-
15
-
16
-
17
-
18
-
19
-
20
-
21
-
22
-
23
-
24
-
25
-
26
-
27
-
28
-
29
-
30
-
31
-
32
-
33
-
34
-
35
-
36
-
37
-
38
-
39
-
40
-
41
-
42
-
43
-
44
-
45
-
46
-
47
-
48
-
49
-
50
-
51
-
52
-
53
-
54
-
55
-
56
-
57
-
58
-
59
-
60
-
61
-
62
-
63
-
64
-
65
-
66
-
67
-
68
-
69
-
70
-
71
-
72
-
73
-
74
-
75
-
76
-
77
-
78
-
79
-
80
-
81
-
82
-
83
-
84
-
85
-
86
-
87
-
88
-
89
-
90
-
91
-
92
-
93
-
94
-
95
-
96
-
97
-
98
-
99
-
100
-
101
-
102
-
103
-
104
-
105
-
106
-
107
-
108
-
109
-
110
-
111
-
112
-
113
-
114
-
115
-
116
-
117
-
118
-
119
-
120
-
 121
121 -
 122
122 -
 123
123 -
 124
124 -
 125
125 -
 126
126 -
 127
127 -
 128
128 -
 129
129 -
 130
130 -
 131
131 -
 132
132 -
 133
133 -
 134
134 -
 135
135 -
 136
136 -
 137
137 -
 138
138 -
 139
139 -
 140
140
 |
 |

GE 2010 ANNUAL REPORT 129
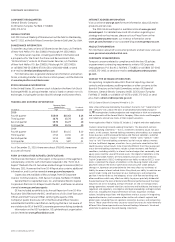
Total revenues
(a) Intersegment revenues
(b) External revenues
(In millions) 2010 2009 2008 2010 2009 2008 2010 2009 2008
Energy Infrastructure $ 37,514 $ 40,648 $ 43,046 $ 316 $ 633 $ 1,098 $ 37,198 $ 40,015 $ 41,948
Technology Infrastructure 37,860 38,517 41,605 250 304 372 37,610 38,213 41,233
NBC Universal 16,901 15,436 16,969 105 71 89 16,796 15,365 16,880
GE Capital 47,040 49,746 67,645 1,207 1,469 1,708 45,833 48,277 65,937
Home & Business Solutions 8,648 8,443 10,117 49 33 68 8,599 8,410 10,049
Corporate items and eliminations 2,248 2,488 2,199 (1,927) (2,510) (3,335) 4,175 4,998 5,534
Total $150,211 $155,278 $181,581 $ — $ — $ — $150,211 $155,278 $181,581
(a) Revenues of GE businesses include income from sales of goods and services to customers and other income.
(b) Sales from one component to another generally are priced at equivalent commercial selling prices.
Revenues from customers located in the United States were $70,506 million, $72,240 million and $85,012 million in 2010, 2009 and 2008,
respectively. Revenues from customers located outside the United States were $79,705 million, $83,038 million and $96,569 million in
2010, 2009 and 2008, respectively.
Property, plant and
Assets (a) (b) equipment additions (c) Depreciation and amortization
At December 31 For the years ended December 31 For the years ended December 31
(In millions) 2010 2009 2008 2010 2009 2008 2010 2009 2008
Energy Infrastructure $ 38,606 $ 36,663 $ 36,973 $ 954 $1,012 $ 1,382 $ 911 $ 994 $ 973
Technology Infrastructure 51,474 50,245 51,863 789 812 1,247 1,643 1,496 1,343
NBC Universal 33,792 32,282 33,781 286 282 131 — 345 354
GE Capital 575,908 607,707 627,501 7,674 6,440 15,325 8,375 9,177 10,226
Home & Business Solutions 4,280 4,955 4,908 229 201 195 354 366 342
Corporate items and eliminations 47,156 50,049 42,815 (111) (79) 349 479 297 299
Total $751,216 $781,901 $797,841 $9,821 $8,668 $18,629 $11,762 $12,675 $13,537
(a) Assets of discontinued operations are included in Corporate items and eliminations for all periods presented.
(b) Total assets of the Energy Infrastructure, Technology Infrastructure, GE Capital and Home & Business Solutions operating segments at December 31, 2010, include investments
in, and advances to, associated companies of $667 million, $856 million, $25,662 million and $430 million, respectively. Investments in, and advances to, associated companies
contributed approximately $58 million, $40 million, $284 million, $2,035 million and $30 million to segment pre-tax income of Energy Infrastructure, Technology Infrastructure,
NBC Universal, GE Capital and Home & Business Solutions operating segments, respectively, for the year ended December 31, 2010. Aggregate summarized financial
information for significant associated companies assuming a 100% ownership interest included: total assets of $198,571 million, primarily financing receivables of
$97,561 million; total liabilities of $152,812 million, primarily bank deposits of $75,661 million; revenues totaling $15,659 million; and net earnings totaling $2,895 million.
(c) Additions to property, plant and equipment include amounts relating to principal businesses purchased.
Property, plant and equipment—net associated with operations based in the United States were $17,596 million, $19,798 million and
$27,667 million at year-end 2010, 2009 and 2008, respectively. Property, plant and equipment—net associated with operations based
outside the United States were $48,618 million, $49,172 million and $50,861 million at year-end 2010, 2009 and 2008, respectively.
Interest and other financial charges Provision (benefit) for income taxes
(In millions) 2010 2009 2008 2010 2009 2008
GE Capital $14,924 $17,491 $24,570 $ (932) $(3,812) $(2,137)
Corporate items and eliminations
(a) 1,059 818 1,188 1,982 2,664 3,239
Total $15,983 $18,309 $25,758 $1,050 $(1,148) $ 1,102
(a) Included amounts for Energy Infrastructure, Technology Infrastructure, NBC Universal and Home & Business Solutions for which our measure of segment profit excludes
interest and other financial charges and income taxes.