GE 2010 Annual Report Download - page 44
Download and view the complete annual report
Please find page 44 of the 2010 GE annual report below. You can navigate through the pages in the report by either clicking on the pages listed below, or by using the keyword search tool below to find specific information within the annual report.-
 1
1 -
2
-
3
-
4
-
5
-
6
-
7
-
8
-
9
-
10
-
11
-
12
-
13
-
14
-
15
-
16
-
17
-
18
-
19
-
20
-
21
-
22
-
23
-
24
-
25
-
26
-
27
-
28
-
29
-
30
-
31
-
32
-
33
-
 34
34 -
 35
35 -
 36
36 -
 37
37 -
 38
38 -
 39
39 -
 40
40 -
 41
41 -
 42
42 -
 43
43 -
 44
44 -
 45
45 -
 46
46 -
 47
47 -
 48
48 -
 49
49 -
 50
50 -
 51
51 -
 52
52 -
 53
53 -
 54
54 -
55
-
56
-
57
-
58
-
59
-
60
-
61
-
62
-
63
-
64
-
65
-
66
-
67
-
68
-
69
-
70
-
71
-
72
-
73
-
74
-
75
-
76
-
77
-
78
-
79
-
80
-
81
-
82
-
83
-
84
-
85
-
86
-
87
-
88
-
89
-
90
-
91
-
92
-
93
-
94
-
95
-
96
-
97
-
98
-
99
-
100
-
101
-
102
-
103
-
104
-
105
-
106
-
107
-
108
-
109
-
110
-
111
-
112
-
113
-
114
-
115
-
116
-
117
-
118
-
119
-
120
-
121
-
122
-
123
-
124
-
125
-
126
-
127
-
128
-
129
-
130
-
131
-
132
-
133
-
134
-
135
-
136
-
137
-
138
-
139
-
140
 |
 |
management’s discussion and analsis
42 GE 2010 ANNUAL REPORT
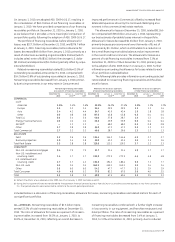
GE Capital revenues decreased 26% and net earnings
decreased 82% in 2009 as compared with 2008. Revenues in 2009
and 2008 included $2.1 billion and $0.4 billion of revenue from
acquisitions, respectively, and in 2009 were reduced by $4.8 bil-
lion as a result of dispositions, including the effect of the
deconsolidation of PTL. Revenues in 2009 also decreased
$14.8 billion compared with 2008 as a result of organic revenue
declines, primarily driven by a lower asset base and a lower inter-
est rate environment, and the stronger U.S. dollar. Net earnings
decreased by $6.6 billion in 2009 compared with 2008, primarily
due to higher provisions for losses on financing receivables asso-
ciated with the challenging economic environment, partially
offset by lower selling, general and administrative costs and the
decision to indefinitely reinvest prior-year earnings outside the
U.S. Net earnings also included restructuring and other charges
for 2009 of $0.4 billion and net losses of $0.1 billion related to
our Treasury operations.
Additional information about certain GE Capital busi-
nesses follows.
CLL 2010 revenues decreased 11% and net earnings increased
61% compared with 2009. Revenues in 2010 and 2009 included
$0.2 billion and $0.1 billion, respectively, from acquisitions,
and in 2010 were reduced by $1.2 billion from dispositions, pri-
marily related to the deconsolidation of PTL, which included
$0.3 billion related to a gain on the sale of a partial interest in a
limited partnership in PTL and remeasurement of our retained
investment. Revenues in 2010 also decreased $1.2 billion
compared with 2009 as a result of organic revenue declines
($1.4 bil lion), partially offset by the weaker U.S. dollar ($0.2 billion).
Net earnings increased by $0.6 billion in 2010, reflecting lower
provisions for losses on financing receivables ($0.6 billion), higher
gains ($0.2 billion) and lower selling, general and administrative
costs ($0.1 billion). These increases were partially offset by
the absence of the gain on the PTL sale and remeasurement
($0.3 billion) and declines in lower-taxed earnings from global
operations ($0.1 billion).
CLL 2009 revenues decreased 23% and net earnings
decreased 48% compared with 2008. Revenues in 2009 and
2008 included $1.9 billion and $0.3 billion from acquisitions,
respectively, and were reduced by $3.2 billion from dispositions,
primarily related to the deconsolidation of PTL. Revenues in 2009
also included $0.3 billion related to a gain on the sale of a partial
interest in a limited partnership in PTL and remeasurement of our
retained investment. Revenues in 2009 decreased $4.7 billion
compared with 2008 as a result of organic revenue declines
($4.0 billion) and the stronger U.S. dollar ($0.7 billion). Net earnings
decreased by $0.9 billion in 2009, reflecting higher provisions for
losses on financing receivables ($0.5 billion), lower gains ($0.5 bil-
lion) and declines in lower-taxed earnings from global operations
($0.4 billion), partially offset by acquisitions ($0.4 billion), higher
investment income ($0.3 billion) and the stronger U.S. dollar
($0.1 billion). Net earnings also included the gain on PTL sale and
remeasurement ($0.3 billion) and higher Genpact gains ($0.1 bil-
lion), partially offset by mark-to-market losses and other-than-
temporary impairments ($0.1 billion).
Consumer 2010 revenues increased 1% and net earnings
increased 85% compared with 2009. Revenues in 2010 were
reduced by $0.3 billion as a result of dispositions. Revenues in
2010 increased $0.5 billion compared with 2009 as a result of the
weaker U.S. dollar ($0.5 billion). The increase in net earnings
resulted primarily from core growth ($1.2 billion) and the weaker
U.S. dollar ($0.1 billion), partially offset by the effects of disposi-
tions ($0.1 billion). Core growth included lower provisions for
losses on financing receivables across most platforms ($1.5 bil-
lion) and lower selling, general and administrative costs
($0.2 billion), partially offset by declines in lower-taxed earnings
from global operations ($0.7 billion) including the absence of the
first quarter 2009 tax benefit ($0.5 billion) from the decision to
indefinitely reinvest prior-year earnings outside the U.S. and an
increase in the valuation allowance associated with Japan
($0.2 billion).
Consumer 2009 revenues decreased 27% and net earnings
decreased 61% compared with 2008. Revenues in 2009 included
$0.2 billion from acquisitions and were reduced by $1.7 billion as a
result of dispositions, and the lack of a current-year counterpart to
the 2008 gain on sale of our Corporate Payment Services (CPS)
business ($0.4 billion). Revenues in 2009 decreased $4.7 billion
compared with 2008 as a result of organic revenue declines
($3.1 billion) and the stronger U.S. dollar ($1.6 billion). The decrease
in net earnings resulted primarily from core declines ($2.4 billion)
and the lack of a current-year counterpart to the 2008 gain on sale
of our CPS business ($0.2 billion). These decreases were partially
offset by higher securitization income ($0.3 billion) and the stron-
ger U.S. dollar ($0.1 billion). Core declines primarily resulted from
lower results in the U.S., U.K., and our banks in Eastern Europe,
reflecting higher provisions for losses on financing receivables
($1.3 billion) and declines in lower-taxed earnings from global
operations ($0.7 billion). The benefit from lower-taxed earnings
from global operations included $0.5 billion from the decision to
indefinitely reinvest prior-year earnings outside the U.S.
Real Estate 2010 revenues decreased 7% and net earn-
ings decreased 13% compared with 2009. Revenues for 2010
decreased $0.3 billion compared with 2009 as a result of organic
revenue declines and a decrease in property sales, partially offset
by the weaker U.S. dollar. Real Estate net earnings decreased
$0.2 billion compared with 2009, primarily from an increase in
impairments related to equity properties and investments
($0.9 billion), partially offset by a decrease in provisions for losses
on financing receivables ($0.4 billion), and core increases ($0.3 bil-
lion). Depreciation expense on real estate equity investments
totaled $1.0 billion and $1.2 billion for 2010 and 2009, respectively.
Real Estate 2009 revenues decreased 40% and net earn-
ings decreased $2.7 billion compared with 2008. Revenues in
2009 decreased $2.6 billion compared with 2008 as a result of
organic revenue declines ($2.4 billion), primarily as a result of a
decrease in sales of properties, and the stronger U.S. dollar
($0.2 billion). Real Estate net earnings decreased $2.7 billion com-
pared with 2008, primarily from an increase in provisions for
losses on financing receivables and impairments ($1.2 billion) and
a decrease in gains on sales of properties as compared to the
prior period ($1.1 billion). In the normal course of our business