GE 2010 Annual Report Download - page 59
Download and view the complete annual report
Please find page 59 of the 2010 GE annual report below. You can navigate through the pages in the report by either clicking on the pages listed below, or by using the keyword search tool below to find specific information within the annual report.-
 1
1 -
2
-
3
-
4
-
5
-
6
-
7
-
8
-
9
-
10
-
11
-
12
-
13
-
14
-
15
-
16
-
17
-
18
-
19
-
20
-
21
-
22
-
23
-
24
-
25
-
26
-
27
-
28
-
29
-
30
-
31
-
32
-
33
-
34
-
35
-
36
-
37
-
38
-
39
-
40
-
41
-
42
-
43
-
44
-
45
-
46
-
47
-
48
-
 49
49 -
 50
50 -
 51
51 -
 52
52 -
 53
53 -
 54
54 -
 55
55 -
 56
56 -
 57
57 -
 58
58 -
 59
59 -
 60
60 -
 61
61 -
 62
62 -
 63
63 -
 64
64 -
 65
65 -
 66
66 -
 67
67 -
 68
68 -
 69
69 -
70
-
71
-
72
-
73
-
74
-
75
-
76
-
77
-
78
-
79
-
80
-
81
-
82
-
83
-
84
-
85
-
86
-
87
-
88
-
89
-
90
-
91
-
92
-
93
-
94
-
95
-
96
-
97
-
98
-
99
-
100
-
101
-
102
-
103
-
104
-
105
-
106
-
107
-
108
-
109
-
110
-
111
-
112
-
113
-
114
-
115
-
116
-
117
-
118
-
119
-
120
-
121
-
122
-
123
-
124
-
125
-
126
-
127
-
128
-
129
-
130
-
131
-
132
-
133
-
134
-
135
-
136
-
137
-
138
-
139
-
140
 |
 |

management’s discussion and analsis
GE 2010 ANNUAL REPORT 57
changes in currency exchange rates on our net investment in
non-U.S. subsidiaries that have functional currencies other than
the U.S. dollar. At the end of 2010, the U.S. dollar was stronger
against most major currencies, including the pound sterling and
the euro and weaker against the Australian dollar, compared
with a weaker dollar against those currencies at the end of
2009 and a stronger dollar against those currencies at the end of
2008. The dollar was weaker against the Japanese yen in 2008.
• The change in fair value of investment securities increased
shareowners’ equity by an insignificant amount in 2010,
reflecting improved market conditions related to U.S.
corporate securities and lower market interest rates and
adjustments to reflect the effect of the unrealized gains on
insurance-related assets and equity. The change in fair value
of investment securities increased shareowners’ equity by
$2.7 billion and decreased shareowners’ equity by $3.2 billion
in 2009 and 2008, respectively. Further information about
investment securities is provided in Note 3.
• Changes in the fair value of derivatives designated as cash
flow hedges increased shareowners’ equity by $0.5 billion in
2010, primarily related to the effective portion of the change
in fair value of designated interest rate and cross currency
hedges and other comprehensive income (OCI) released to
earnings to match the underlying forecasted cash flows. The
change in the fair value of derivatives designated as cash flow
hedges increased equity by $1.6 billion and decreased equity
by $2.7 billion in 2009 and 2008, respectively. Further informa-
tion about the fair value of derivatives is provided in Note 22.
We took a number of actions in 2008 and 2009 to strengthen
our liquidity. Such actions also had an effect on shareowners’
equity, which included a $15 billion addition to equity through
common and preferred stock offerings in the fourth quarter
of 2008.
Statement of Cash Flows—Overview from 2008 through 2010
Consolidated cash and equivalents were $79.0 billion at
December 31, 2010, an increase of $8.5 billion from December 31,
2009. Cash and equivalents totaled $70.5 billion at December 31,
2009, an increase of $22.4 billion from December 31, 2008.
We evaluate our cash flow performance by reviewing our
industrial (non-financial services) businesses and financial services
businesses separately. Cash from operating activities (CFOA) is the
principal source of cash generation for our industrial businesses.
The industrial businesses also have liquidity available via the public
capital markets. Our financial services businesses use a variety of
financial resources to meet our capital needs. Cash for financial
services businesses is primarily provided from the issuance of term
debt and commercial paper in the public and private markets, as
well as financing receivables collections, sales and securitizations.
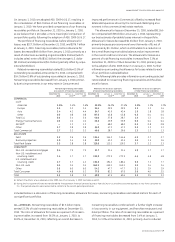
GE Cash Flow
GE cash and equivalents were $19.2 billion at December 31, 2010,
compared with $8.7 billion at December 31, 2009. GE CFOA totaled
$14.7 billion in 2010 compared with $16.4 billion and $19.1 billion
in 2009 and 2008, respectively. With respect to GE CFOA, we
believe that it is useful to supplement our GE Statement of Cash
Flows and to examine in a broader context the business activi-
ties that provide and require cash.
December 31 (In billions) 2010 2009 2008
Operating cash collections(a) $ 98.2 $104.1 $115.5
Operating cash payments (83.5) (87.7) (98.8)
Cash dividends from GECS — — 2.4
GE cash from operating
activities (GE CFOA)(a) $ 14.7 $ 16.4 $ 19.1
(a) GE sells customer receivables to GECS in part to fund the growth of our industrial
businesses. These transactions can result in cash generation or cash use. During
any given period, GE receives cash from the sale of receivables to GECS. It also
foregoes collection of cash on receivables sold. The incremental amount of cash
received from sale of receivables in excess of the cash GE would have otherwise
collected had those receivables not been sold, represents the cash generated or
used in the period relating to this activity. The incremental cash generated in
GE CFOA from selling these receivables to GECS increased GE CFOA by
$0.3 billion and an insignificant amount in 2010 and 2009, respectively. See
Note 27 for additional information about the elimination of intercompany
transactions between GE and GECS.
The most significant source of cash in GE CFOA is customer-
related activities, the largest of which is collecting cash following
a product or services sale. GE operating cash collections
decreased by $5.9 billion in 2010 and decreased by $11.4 billion
in 2009. These changes are consistent with the changes in
comparable GE operating segment revenues. Analyses of oper-
ating segment revenues discussed in the preceding Segment
Operations section are the best way of understanding their
customer-related CFOA.
The most significant operating use of cash is to pay our sup-
pliers, employees, tax authorities and others for a wide range of
material and services. GE operating cash payments decreased
in 2010 and 2009 by $4.2 billion and $11.1 billion, respectively.
These changes are consistent with the changes in GE total
costs and expenses.
GE CFOA decreased $1.7 billion compared with 2009, primarily
reflecting a decrease in progress collections compared to 2009.
In 2009, GE CFOA decreased $2.7 billion compared with 2008, pri-
marily reflecting the lack of a dividend from GECS ($2.4 billion).
Dividends from GECS represented the distribution of a portion
of GECS retained earnings and are distinct from cash from continu-
ing operating activities within the financial services businesses.
The amounts included in GE CFOA are the total dividends, includ-
ing normal dividends as well as any special dividends from excess
capital, primarily resulting from GECS business sales. Beginning
in the first quarter of 2009, GECS suspended its normal divi dend
to GE. There were no special dividends received from GECS in
2010, 2009 or 2008.