GE 2010 Annual Report Download - page 111
Download and view the complete annual report
Please find page 111 of the 2010 GE annual report below. You can navigate through the pages in the report by either clicking on the pages listed below, or by using the keyword search tool below to find specific information within the annual report.-
 1
1 -
2
-
3
-
4
-
5
-
6
-
7
-
8
-
9
-
10
-
11
-
12
-
13
-
14
-
15
-
16
-
17
-
18
-
19
-
20
-
21
-
22
-
23
-
24
-
25
-
26
-
27
-
28
-
29
-
30
-
31
-
32
-
33
-
34
-
35
-
36
-
37
-
38
-
39
-
40
-
41
-
42
-
43
-
44
-
45
-
46
-
47
-
48
-
49
-
50
-
51
-
52
-
53
-
54
-
55
-
56
-
57
-
58
-
59
-
60
-
61
-
62
-
63
-
64
-
65
-
66
-
67
-
68
-
69
-
70
-
71
-
72
-
73
-
74
-
75
-
76
-
77
-
78
-
79
-
80
-
81
-
82
-
83
-
84
-
85
-
86
-
87
-
88
-
89
-
90
-
91
-
92
-
93
-
94
-
95
-
96
-
97
-
98
-
99
-
100
-
 101
101 -
 102
102 -
 103
103 -
 104
104 -
 105
105 -
 106
106 -
 107
107 -
 108
108 -
 109
109 -
 110
110 -
 111
111 -
 112
112 -
 113
113 -
 114
114 -
 115
115 -
 116
116 -
 117
117 -
 118
118 -
 119
119 -
 120
120 -
 121
121 -
122
-
123
-
124
-
125
-
126
-
127
-
128
-
129
-
130
-
131
-
132
-
133
-
134
-
135
-
136
-
137
-
138
-
139
-
140
 |
 |

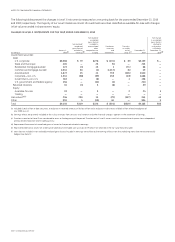
GE 2010 ANNUAL REPORT 109
Netting
(In millions) Level 1 (a) Level 2 (a) Level 3
(b) adjustment (c) Net balance
DECEMBER 31, 2010
ASSETS
Investment securities
Debt
U.S. corporate $ — $19,374 $ 3,199 $ — $22,573
State and municipal — 2,499 225 — 2,724
Residential mortgage-backed 47 2,696 66 — 2,809
Commercial mortgage-backed — 2,875 49 — 2,924
Asset-backed — 690 2,540 — 3,230
Corporate—non-U.S. 89 1,292 1,486 — 2,867
Government—non-U.S. 777 1,333 156 — 2,266
U.S. government and federal agency — 3,158 210 — 3,368
Retained interests
(d) — — 39 — 39
Equity
Available-for-sale 677 20 24 — 721
Trading 417 — — — 417
Derivatives (e)
— 10,997 359 (3,867) 7,489
Other
(f) — — 906 — 906
Total $2,007 $44,934 $ 9,259 $(3,867) $52,333
LIABILITIES
Derivatives $ — $ 6,553 $ 103 $(3,857) $ 2,799
Other
(g) — 920 — — 920
Total $ — $ 7,473 $ 103 $(3,857) $ 3,719
DECEMBER 31, 2009
ASSETS
Investment securities
Debt
U.S. corporate $ 555 $19,033 $ 3,068 $ — $22,656
State and municipal — 2,189 205 — 2,394
Residential mortgage-backed — 3,195 123 — 3,318
Commercial mortgage-backed — 2,647 58 — 2,705
Asset-backed — 860 1,874 — 2,734
Corporate—non-U.S. 154 755 1,114 — 2,023
Government—non-U.S. 1,114 1,374 163 — 2,651
U.S. government and federal agency 9 2,307 256 — 2,572
Retained interests — — 8,831 — 8,831
Equity
Available-for-sale 536 184 19 — 739
Trading 720 — — — 720
Derivatives (e)
— 11,053 804 (3,851) 8,006
Other
(f) — — 965 — 965
Total $3,088 $43,597 $17,480 $(3,851) $60,314
LIABILITIES
Derivatives $ — $ 7,298 $ 222 $(3,860) $ 3,660
Other
(g) — 798 — — 798
Total $ — $ 8,096 $ 222 $(3,860) $ 4,458
(a) Included in Level 1 at December 31, 2010 was $76 million of available-for-sale equity transferred from Level 2 due to the expiration of sale restrictions on the security.
Additionally, $110 million of government non-U.S. bonds were reclassified from Level 1 to Level 2. Other transfers to and from Level 1 and Level 2 were insignificant.
(b) Level 3 investment securities valued using non-binding broker quotes totaled $1,054 million and $1,042 million at December 31, 2010 and 2009, respectively, and were
classified as available-for-sale securities.
(c) The netting of derivative receivables and payables is permitted when a legally enforceable master netting agreement exists. Included fair value adjustments related to our
own and counterparty credit risk.
(d) Substantially all of our retained interests were consolidated in connection with our adoption of ASU 2009-16 & 17 on January 1, 2010.
(e) The fair value of derivatives included an adjustment for non-performance risk. At December 31, 2010 and 2009, the cumulative adjustment was a loss of $10 million and a
gain of $9 million, respectively. See Note 22 for additional information on the composition of our derivative portfolio.
(f) Included private equity investments and loans designated under the fair value option.
(g) Primarily represented the liability associated with certain of our deferred incentive compensation plans.