Humana 2002 Annual Report Download - page 14
Download and view the complete annual report
Please find page 14 of the 2002 Humana annual report below. You can navigate through the pages in the report by either clicking on the pages listed below, or by using the keyword search tool below to find specific information within the annual report.-
 1
1 -
2
-
3
-
 4
4 -
 5
5 -
 6
6 -
 7
7 -
 8
8 -
 9
9 -
 10
10 -
 11
11 -
 12
12 -
 13
13 -
 14
14 -
 15
15 -
 16
16 -
 17
17 -
 18
18 -
 19
19 -
 20
20 -
 21
21 -
 22
22 -
 23
23 -
 24
24 -
25
-
26
-
27
-
28
-
29
-
30
-
31
-
32
-
33
-
34
-
35
-
36
-
37
-
38
-
39
-
40
-
41
-
42
-
43
-
44
-
45
-
46
-
47
-
48
-
49
-
50
-
51
-
52
-
53
-
54
-
55
-
56
-
57
-
58
-
59
-
60
-
61
-
62
-
63
-
64
-
65
-
66
-
67
-
68
-
69
-
70
-
71
-
72
-
73
-
74
-
75
-
76
-
77
-
78
-
79
-
80
-
81
-
82
-
83
-
84
-
85
-
86
-
87
-
88
-
89
-
90
-
91
-
92
-
93
-
94
-
95
-
96
-
97
-
98
-
99
-
100
-
101
-
102
-
103
-
104
-
105
-
106
-
107
-
108
 |
 |

Medicaid managed care initiative that must be approved by CMS. CMS requires that Medicaid managed care
plans meet federal standards and cost no more than the amount that would have been spent on a comparable fee-
for-service basis. States currently either use a formal proposal process in which they review many bidders before
selecting one or award individual contracts to qualified bidders which apply for entry to the program. In either
case, the contractual relationship with a state is generally for a one-year period. Under these contracts, we receive
a fixed monthly payment from a government agency for which we are required to provide health insurance
coverage to enrolled members. Due to the increased emphasis on state health care reform and budgetary
constraints, more states are utilizing a managed care product in their Medicaid programs.
Effective July 1, 2002, we signed two contracts in Puerto Rico covering beneficiaries in two of the eight
regions in Puerto Rico’s Medicaid program. The term of each of these contracts is three years, subject to annual
renewal options with the Health Insurance Administration in Puerto Rico. Our Medicaid contracts in Florida and
Illinois generally are annual contracts. For the year ended December 31, 2002, premium revenues from our
Medicaid products totaled $463.0 million, or 4.1% of our total premiums and ASO fees. At December 31, 2002,
we had approximately 434,800 Medicaid members in Puerto Rico, or 86% of total Medicaid members, and
71,200 Medicaid members in Florida and Illinois, or 14% of total Medicaid members.
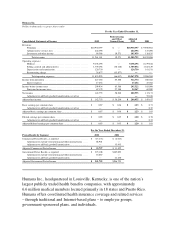
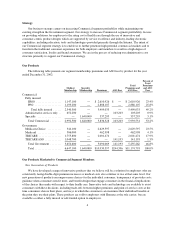
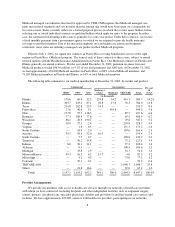
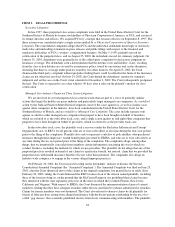
The following table summarizes our medical membership at December 31, 2002, by market and product:
Commercial Government Percent
Of
TotalHMO PPO ASO
Medicare +
Choice Medicaid TRICARE Total
(in thousands)
Florida.................... 170.6 60.4 12.5 228.8 54.2 414.1 940.7 14.2%
Illinois .................... 303.7 243.2 87.1 58.8 17.0 76.3 786.0 11.8
Texas..................... 214.8 262.8 29.5 24.3 — — 531.3 8.0
Puerto Rico ................ 17.6 46.9 5.1 — 434.8 — 504.3 7.6
Ohio ..................... 177.8 55.7 118.5 — — 85.7 437.6 6.6
Kentucky.................. 77.3 188.4 77.6 — — 65.5 408.9 6.2
Wisconsin ................. 86.1 40.5 190.7 — — 29.6 347.1 5.2
Georgia ................... 18.4 37.1 2.4 — — 270.8 328.7 4.9
Virginia................... — 1.6 0.3 — — 171.3 173.2 2.6
NorthCarolina ............. — 18.9 3.0 — — 139.6 161.4 2.4
Arizona ................... 35.5 50.4 52.0 16.5 — — 154.4 2.3
South Carolina ............. — 5.5 0.7 — — 128.8 134.9 2.0
Tennessee ................. — 36.2 15.8 — — 75.1 127.1 1.9
Indiana ................... 6.0 30.1 31.1 — — 37.2 104.4 1.6
Alabama .................. — 0.1 — — — 100.5 100.6 1.5
Michigan.................. — 33.8 2.9 — — 54.7 91.4 1.4
Missouri/Kansas ............ 39.3 16.5 6.2 15.7 — 4.6 82.3 1.2
Mississippi ................ — 4.2 0.3 — — 73.0 77.5 1.2
Colorado .................. — 39.1 0.1 — — — 39.2 0.6
TRICARE ASO ............ — — — — — 1,048.7 1,048.7 15.8
Others .................... — 21.8 16.4 — — 29.0 67.4 1.0
Totals ................ 1,147.1 1,193.2 652.2 344.1 506.0 2,804.5 6,647.1 100.0%
Provider Arrangements
We provide our members with access to health care services through our networks of health care providers
with whom we have contracted, including hospitals and other independent facilities such as outpatient surgery
centers, primary care physicians, specialist physicians, dentists and providers of ancillary health care services and
facilities. We have approximately 425,000 contracts with health care providers participating in our networks,
8