Humana 2002 Annual Report Download - page 34
Download and view the complete annual report
Please find page 34 of the 2002 Humana annual report below. You can navigate through the pages in the report by either clicking on the pages listed below, or by using the keyword search tool below to find specific information within the annual report.-
 1
1 -
2
-
3
-
4
-
5
-
6
-
7
-
8
-
9
-
10
-
11
-
12
-
13
-
14
-
15
-
16
-
17
-
18
-
19
-
20
-
21
-
22
-
23
-
 24
24 -
 25
25 -
 26
26 -
 27
27 -
 28
28 -
 29
29 -
 30
30 -
 31
31 -
 32
32 -
 33
33 -
 34
34 -
 35
35 -
 36
36 -
 37
37 -
 38
38 -
 39
39 -
 40
40 -
 41
41 -
 42
42 -
 43
43 -
 44
44 -
45
-
46
-
47
-
48
-
49
-
50
-
51
-
52
-
53
-
54
-
55
-
56
-
57
-
58
-
59
-
60
-
61
-
62
-
63
-
64
-
65
-
66
-
67
-
68
-
69
-
70
-
71
-
72
-
73
-
74
-
75
-
76
-
77
-
78
-
79
-
80
-
81
-
82
-
83
-
84
-
85
-
86
-
87
-
88
-
89
-
90
-
91
-
92
-
93
-
94
-
95
-
96
-
97
-
98
-
99
-
100
-
101
-
102
-
103
-
104
-
105
-
106
-
107
-
108
 |
 |
Our TRICARE contracts also contain risk-sharing provisions with the federal government to minimize any
losses and limit any profits in the event that medical costs for which we are at risk differ from the levels targeted
in our contracts. Amounts receivable from the federal government under such risk-sharing provisions are
included in the BPA receivable above, while amounts payable to the federal government under these provisions
of approximately $23 million are included in trade accounts payable and accrued expenses in our consolidated
balance sheets.
Investment Securities
Investment securities totaled $1,694.6 million, or 37% of total assets at December 31, 2002. Debt securities
totaled $1,637.5 million, or 97% of our total investment portfolio. The average duration of our debt securities
was approximately 3 years and more than 95% of our debt securities were of investment-grade quality with an
average of AA by Standard & Poor’s at December 31, 2002. Most of the debt securities that are below
investment grade are rated at the higher end of the non-investment grade spectrum. Our investment policy limits
investments in a single issuer and requires diversification among various asset types.
Our investment securities are categorized as available for sale and, as a result, are stated at fair value. Fair
value of publicly traded debt and equity securities are based on quoted market prices. Non traded debt securities
are priced independently by a third party vendor. Fair value of strategic venture capital debt and equity securities
that are privately held, or where an observable quoted market price does not exist, are estimated using a variety
of valuation methodologies. Such methodologies include reviewing the value ascribed to the most recent
financing, comparing the security with securities of publicly traded companies in a similar line of business, and
reviewing the underlying financial performance including estimating discounted cash flows. Unrealized holding
gains and losses, net of applicable deferred taxes, are included as a component of stockholders’ equity until
realized from a sale or impairment.
Gross unrealized losses totaled $12.6 million, or 0.7% of our total investment portfolio at December 31,
2002 compared to $19.5 million, or 1.2% at December 31, 2001. We had no material unrealized loss on any one
individual investment security or within any one industry at December 31, 2002. We regularly evaluate our
investment securities for impairment. We consider factors affecting the investee, factors affecting the industry
the investee operates within, and general debt and equity market trends. We consider the length of time an
investment’s fair value has been below carrying value, the near term prospects for recovery to carrying value and
our intent and ability to hold the investment until maturity or market recovery is realized. If and when a
determination is made that a decline in fair value below the cost basis is other than temporary, the related
investment is written down to its estimated fair value through earnings. The risks inherent in assessing the
impairment of an investment include the risk that market factors may differ from our expectations; facts and
circumstances factored into our assessment may change with the passage of time; or we may decide to
subsequently sell the investment. The determination of whether a decline in the value of an investment is other
than temporary requires us to exercise significant diligence and judgment. The discovery of new information and
the passage of time can significantly change these judgments. The current economic environment and recent
volatility of securities markets increase the difficulty of determining fair value and assessing investment
impairment. The same influences tend to increase the risk of potentially impaired assets.
Gross realized losses in 2002 included impairment losses of $19.6 million related to privately held
investment securities after an evaluation indicated that a decline in fair value below the cost basis was other than
temporary.
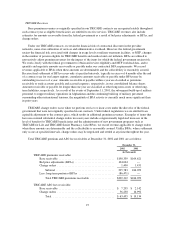
Goodwill and Long-lived Asset
At December 31, 2002, goodwill and other long-lived assets represented 28% of total assets and 79% of
total stockholders’ equity.
28