Humana 2002 Annual Report Download - page 40
Download and view the complete annual report
Please find page 40 of the 2002 Humana annual report below. You can navigate through the pages in the report by either clicking on the pages listed below, or by using the keyword search tool below to find specific information within the annual report.-
 1
1 -
2
-
3
-
4
-
5
-
6
-
7
-
8
-
9
-
10
-
11
-
12
-
13
-
14
-
15
-
16
-
17
-
18
-
19
-
20
-
21
-
22
-
23
-
24
-
25
-
26
-
27
-
28
-
29
-
 30
30 -
 31
31 -
 32
32 -
 33
33 -
 34
34 -
 35
35 -
 36
36 -
 37
37 -
 38
38 -
 39
39 -
 40
40 -
 41
41 -
 42
42 -
 43
43 -
 44
44 -
 45
45 -
 46
46 -
 47
47 -
 48
48 -
 49
49 -
 50
50 -
51
-
52
-
53
-
54
-
55
-
56
-
57
-
58
-
59
-
60
-
61
-
62
-
63
-
64
-
65
-
66
-
67
-
68
-
69
-
70
-
71
-
72
-
73
-
74
-
75
-
76
-
77
-
78
-
79
-
80
-
81
-
82
-
83
-
84
-
85
-
86
-
87
-
88
-
89
-
90
-
91
-
92
-
93
-
94
-
95
-
96
-
97
-
98
-
99
-
100
-
101
-
102
-
103
-
104
-
105
-
106
-
107
-
108
 |
 |
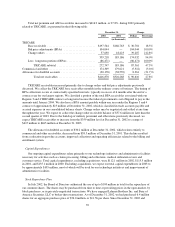
membership to a heavier concentration of larger group sizes. Large group commercial membership represents
approximately 65% of our fully insured commercial membership at December 31, 2002 compared to 62% at
December 31, 2001. Large group membership traditionally experiences a higher medical expense ratio and a
lower selling, general and administrative expense ratio than does our small group membership.
The Government segment medical expense ratio for 2002 was 83.8%, increasing 20 basis points from 83.6%
for 2001. This increase primarily was attributable to TRICARE. As discussed previously, TRICARE medical
expense increased due to expanded benefits for TRICARE beneficiaries mandated by Congress, an increase in
eligible beneficiaries, and an increase in the use of Humana’s provider network rather than military treatment
facilities. Since these actions were not originally specified in our contracts or were for items that the Department
of Defense retains financial risk, we were entitled to equitable revenue adjustments through the change order and
bid price adjustment processes. These higher medical expenses combined with the associated higher premium
revenues resulted in an overall increase in the Government medical expense ratio.
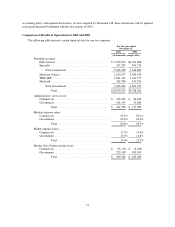
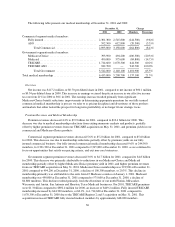
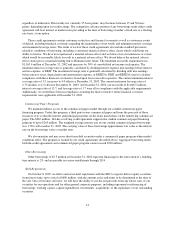
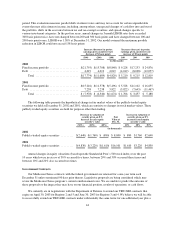
SG&A Expense
Total selling, general and administrative, or SG&A, expenses as a percentage of premium revenues and
administrative services fees, or SG&A expense ratio, for 2002 was 15.6%, increasing 30 basis points from 15.3%
for 2001. During the fourth quarter of 2002, we recorded $30.1 million of administrative expenses for a
contingent contractual provider dispute and other items associated with our 1997 acquisition of Physician
Corporation of America, or PCA. Of the total $30.1 million of administrative expenses, which amounts to a
30 basis point increase in the 2002 SG&A expense ratio, $28.4 million impacted our Commercial segment and
$1.7 million impacted our Government segment.
The Commercial segment’s SG&A expense ratio was 17.5% for 2002, decreasing 10 basis points from 2001
of 17.6%. The PCA items discussed above accounted for a 30 basis point increase in this ratio. The remaining
40 basis point decline in the SG&A ratio was driven primarily by the changing mix of members towards more
larger group members and reductions in the number of our employees due to operational efficiencies gained from
streamlining various processes through technology and other initiatives. Costs to distribute and administer our
products to large group members are lower than that of small group members.
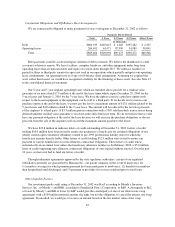
The Government segment’s SG&A expense ratio was 13.3% for 2002, increasing 50 basis points compared
to 12.8% in 2001. This increase resulted from a higher proportion of revenues generated from administrative
services fees, primarily from the TRICARE Regions 2 and 5 acquisition and the implementation of the
TRICARE for Life benefit programs effective October 1, 2001, as discussed above. ASO business carries a much
higher SG&A ratio than fully insured business.
We expect our total SG&A expense ratio to decline by approximately 80 basis points in 2003 due to our
plan to realign our operating model around our commercial strategy and reductions in our administrative cost
structure, including the consolidation of seven customer service centers into four and an enterprise-wide
workforce reduction.
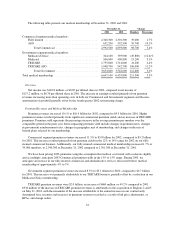
Depreciation and amortization was $120.7 million in 2002, a decrease of $40.8 million, or 25.3%, from
$161.5 million in 2001. On a comparable basis, depreciation and amortization was $106.5 in 2001, excluding
goodwill amortization expense. The $14.2 million increase in 2002 compared to 2001, as adjusted, results from
capital expenditures primarily related to our technology initiatives and the TRICARE acquisition of Regions 2
and 5 on May 31, 2001.
Interest Expense
Interest expense was $17.3 million in 2002, a decrease of $8.0 million from $25.3 million in 2001. This
decrease primarily resulted from lower interest rates.
34