Humana 2002 Annual Report Download - page 78
Download and view the complete annual report
Please find page 78 of the 2002 Humana annual report below. You can navigate through the pages in the report by either clicking on the pages listed below, or by using the keyword search tool below to find specific information within the annual report.-
 1
1 -
2
-
3
-
4
-
5
-
6
-
7
-
8
-
9
-
10
-
11
-
12
-
13
-
14
-
15
-
16
-
17
-
18
-
19
-
20
-
21
-
22
-
23
-
24
-
25
-
26
-
27
-
28
-
29
-
30
-
31
-
32
-
33
-
34
-
35
-
36
-
37
-
38
-
39
-
40
-
41
-
42
-
43
-
44
-
45
-
46
-
47
-
48
-
49
-
50
-
51
-
52
-
53
-
54
-
55
-
56
-
57
-
58
-
59
-
60
-
61
-
62
-
63
-
64
-
65
-
66
-
67
-
 68
68 -
 69
69 -
 70
70 -
 71
71 -
 72
72 -
 73
73 -
 74
74 -
 75
75 -
 76
76 -
 77
77 -
 78
78 -
 79
79 -
 80
80 -
 81
81 -
 82
82 -
 83
83 -
 84
84 -
 85
85 -
 86
86 -
 87
87 -
 88
88 -
89
-
90
-
91
-
92
-
93
-
94
-
95
-
96
-
97
-
98
-
99
-
100
-
101
-
102
-
103
-
104
-
105
-
106
-
107
-
108
 |
 |

Humana Inc.
NOTES TO CONSOLIDATED FINANCIAL STATEMENTS—(Continued)
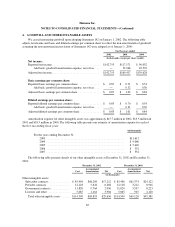
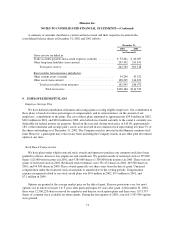
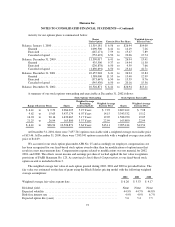
Activity for our options plans is summarized below:
Shares
Under Option Exercise Price Per Share
Weighted Average
Exercise Price
Balance, January 1, 2000 ........................ 11,319,181 $ 6.56 to $26.94 $14.00
Granted ................................. 1,090,500 6.41 to 14.19 7.26
Exercised ................................ (267,171) 7.59 to 15.47 7.89
Canceled or lapsed ......................... (752,493) 6.50 to 23.06 15.74
Balance, December 31, 2000 ..................... 11,390,017 6.41 to 26.94 13.41
Granted ................................. 935,500 9.37 to 14.94 11.30
Exercised ................................ (236,878) 6.50 to 9.59 7.66
Canceled or lapsed ......................... (1,630,691) 6.50 to 23.44 16.71
Balance, December 31, 2001 ..................... 10,457,948 6.41 to 26.94 12.84
Granted ................................. 1,588,000 11.55 to 15.40 12.99
Exercised ................................ (973,647) 6.50 to 15.59 8.76
Canceled or lapsed ......................... (545,430) 6.50 to 20.16 15.36
Balance, December 31, 2002 ..................... 10,526,871 $ 6.41 to $26.94 $13.11
A summary of our stock options outstanding and exercisable at December 31, 2002 follows:
Stock Options Outstanding Stock Options Exercisable
Range of Exercise Prices Shares
Weighted Average
Remaining
Contractual Life
Weighted Average
Exercise Price Shares
Weighted Average
Exercise Price
$ 6.41 to $ 9.59 3,284,225 5.27 Years $ 7.92 2,807,162 $ 7.98
9.62 to 15.63 5,437,179 6.07 Years 14.15 3,343,532 15.12
16.94 to 20.16 1,639,667 5.17 Years 19.05 1,588,920 19.05
21.25 to 26.94 165,800 3.37 Years 22.99 165,800 22.99
$ 6.41 to $26.94 10,526,871 5.64 Years $13.11 7,905,414 $13.54
At December 31, 2001, there were 7,657,741 options exercisable with a weighted average exercisable price
of $13.46. At December 31, 2000, there were 7,583,941 options exercisable with a weighted average exercisable
price of $14.09.
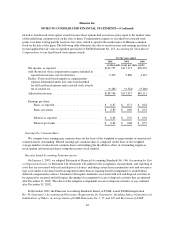
We account for our stock option plan under APB No. 25 and accordingly no employee compensation cost
has been recognized for our fixed-based stock option awards other than for modifications of option terms that
result in a new measurement date. Compensation expense related to modifications was not material for 2002,
2001, and 2000. The effects on net income and earnings per share if we had applied the fair value recognition
provisions of FASB Statement No. 123, Accounting for Stock-Based Compensation, to our fixed-based stock
option awards is included in Note 2.
The weighted average fair value of each option granted during 2002, 2001 and 2000 is provided below. The
fair value was estimated on the date of grant using the Black-Scholes pricing model with the following weighted
average assumptions:
2002 2001 2000
Weighted average fair value at grant date ................................. $ 6.26 $ 5.53 $ 4.17
Dividend yield ...................................................... None None None
Expected volatility ................................................... 44.9% 44.7% 44.8%
Risk-free interest rate ................................................ 4.9% 4.9% 6.7%
Expected option life (years) ........................................... 5.6 5.4 7.5
72