Humana 2002 Annual Report Download - page 71
Download and view the complete annual report
Please find page 71 of the 2002 Humana annual report below. You can navigate through the pages in the report by either clicking on the pages listed below, or by using the keyword search tool below to find specific information within the annual report.-
 1
1 -
2
-
3
-
4
-
5
-
6
-
7
-
8
-
9
-
10
-
11
-
12
-
13
-
14
-
15
-
16
-
17
-
18
-
19
-
20
-
21
-
22
-
23
-
24
-
25
-
26
-
27
-
28
-
29
-
30
-
31
-
32
-
33
-
34
-
35
-
36
-
37
-
38
-
39
-
40
-
41
-
42
-
43
-
44
-
45
-
46
-
47
-
48
-
49
-
50
-
51
-
52
-
53
-
54
-
55
-
56
-
57
-
58
-
59
-
60
-
 61
61 -
 62
62 -
 63
63 -
 64
64 -
 65
65 -
 66
66 -
 67
67 -
 68
68 -
 69
69 -
 70
70 -
 71
71 -
 72
72 -
 73
73 -
 74
74 -
 75
75 -
 76
76 -
 77
77 -
 78
78 -
 79
79 -
 80
80 -
 81
81 -
82
-
83
-
84
-
85
-
86
-
87
-
88
-
89
-
90
-
91
-
92
-
93
-
94
-
95
-
96
-
97
-
98
-
99
-
100
-
101
-
102
-
103
-
104
-
105
-
106
-
107
-
108
 |
 |

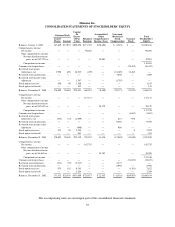
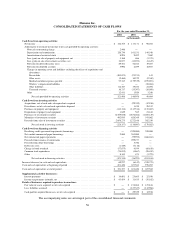
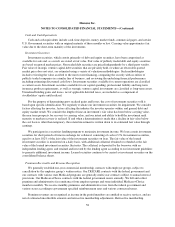
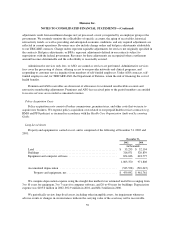
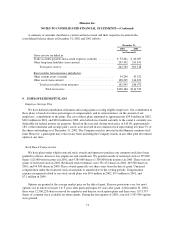
Humana Inc.
NOTES TO CONSOLIDATED FINANCIAL STATEMENTS—(Continued)
4. GOODWILL AND OTHER INTANGIBLE ASSETS
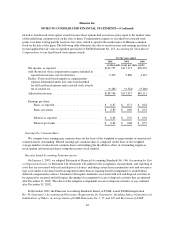
We ceased amortizing goodwill upon adopting Statement 142 on January 1, 2002. The following table
adjusts net income and basic and diluted earnings per common share to reflect the non-amortization of goodwill
assuming the non-amortization provisions of Statement 142 were adopted as of January 1, 2000:
For the years ended
2002 2001 2000
(in thousands, except per share results)
Net income:
Reported net income .................................. $142,755 $117,171 $ 90,052
Add back: goodwill amortization expense, net of tax .... — 52,246 49,576
Adjusted net income .................................. $142,755 $169,417 $139,628
Basic earnings per common share:
Reported basic earnings per common share ................ $ 0.87 $ 0.71 $ 0.54
Add back: goodwill amortization expense, net of tax .... — 0.32 0.30
Adjusted basic earnings per common share ................ $ 0.87 $ 1.03 $ 0.84
Diluted earnings per common share:
Reported diluted earnings per common share .............. $ 0.85 $ 0.70 $ 0.54
Add back: goodwill amortization expense, net of tax .... — 0.31 0.30
Adjusted diluted earnings per common share .............. $ 0.85 $ 1.01 $ 0.84
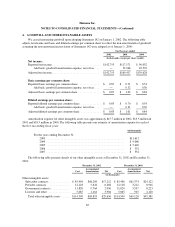
Amortization expense for other intangible assets was approximately $15.7 million in 2002, $13.5 million in
2001 and $10.3 million in 2000. The following table presents our estimate of amortization expense for each of
the five succeeding fiscal years:
(in thousands)
For the years ending December 31:
2003 ....................................................... $11,612
2004 ....................................................... $ 9,060
2005 ....................................................... $ 5,440
2006 ....................................................... $ 352
2007 ....................................................... $ 352
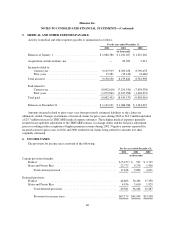
The following table presents details of our other intangible assets at December 31, 2002 and December 31,
2001:
December 31, 2002 December 31, 2001
Cost
Accumulated
Amortization Net Cost
Accumulated
Amortization Net
(in thousands)
Other intangible assets:
Subscriber contracts .............. $ 85,496 $68,284 $17,212 $ 85,496 $61,374 $24,122
Provider contracts ................ 12,128 5,644 6,484 12,128 3,212 8,916
Government contracts ............. 11,820 9,764 2,056 11,820 3,597 8,223
Licenses and other ............... 5,065 1,161 3,904 5,065 945 4,120
Total other intangible assets ...... $114,509 $84,853 $29,656 $114,509 $69,128 $45,381
65