Humana 2002 Annual Report Download - page 4
Download and view the complete annual report
Please find page 4 of the 2002 Humana annual report below. You can navigate through the pages in the report by either clicking on the pages listed below, or by using the keyword search tool below to find specific information within the annual report.-
 1
1 -
 2
2 -
 3
3 -
 4
4 -
 5
5 -
 6
6 -
 7
7 -
 8
8 -
 9
9 -
 10
10 -
 11
11 -
 12
12 -
 13
13 -
 14
14 -
 15
15 -
16
-
17
-
18
-
19
-
20
-
21
-
22
-
23
-
24
-
25
-
26
-
27
-
28
-
29
-
30
-
31
-
32
-
33
-
34
-
35
-
36
-
37
-
38
-
39
-
40
-
41
-
42
-
43
-
44
-
45
-
46
-
47
-
48
-
49
-
50
-
51
-
52
-
53
-
54
-
55
-
56
-
57
-
58
-
59
-
60
-
61
-
62
-
63
-
64
-
65
-
66
-
67
-
68
-
69
-
70
-
71
-
72
-
73
-
74
-
75
-
76
-
77
-
78
-
79
-
80
-
81
-
82
-
83
-
84
-
85
-
86
-
87
-
88
-
89
-
90
-
91
-
92
-
93
-
94
-
95
-
96
-
97
-
98
-
99
-
100
-
101
-
102
-
103
-
104
-
105
-
106
-
107
-
108
 |
 |
We also reengineered many of our business processes in 2002. We’ve taken steps to reduce complexity in
the organization and simplify our business transactions through such initiatives as reconfiguring the roles of our
field personnel involved in provider affairs, finance, and medical management, automating many of our Human
Resources functions, and e-procurement.
2002 Financial Highlights
Adjusted 2002 results in the following discussion exclude from Generally Accepted Accounting Principles
(GAAP) results the impact of unusual items recorded during that year. Management believes that these
unusual items should be excluded to properly reflect the run-rate operations of the company and to
provide better comparability to prior year results.
Adjusted results for 2001 exclude from previously reported GAAP results amortization expense for goodwill
to facilitate comparability. GAAP required all companies to cease amortizing goodwill effective
January 1, 2002.
A detailed reconciliation between GAAP and adjusted results follows this Letter to Shareholders.
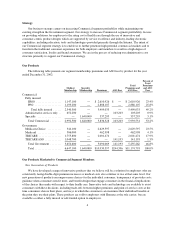
The achievement of the operational milestones described above has driven significantly improved financial
results for 2002. Our adjusted earnings per diluted share of $1.20 was up 19 percent from $1.01 in 2001. The
drivers of our profit improvement included:
ŠA 17 percent increase in adjusted pre-tax profits for the Government segment, with increases across
each of the product lines in that segment, and
ŠA 71 percent improvement in our Commercial segment adjusted pre-tax profits.
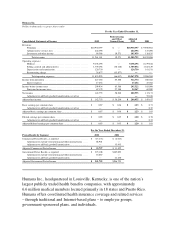
Our consolidated adjusted revenues increased 11 percent, or $1.1 billion, to $11.3 billion in 2002 versus
$10.2 billion in 2001. This increase in adjusted revenues reflects percentage increases of 10 to 11 percent in the
adjusted revenues for each of our two business segments.
Medical membership increased to 6.6 million members at December 31, 2002 compared with 6.4 million at
the end of 2001. Both of our business segments were additive to our membership this year, as Commercial
segment sales increased for the first time in several years, and the number of beneficiaries eligible for the
TRICARE program expanded.
Our medical expense ratio (medical expenses as a percent of premiums) was 83.6 percent in 2002 compared
with 83.3 percent in 2001. This increase was expected and reflects a shift in the mix of our Commercial business,
weighting more heavily towards large group employers.
In 2002, our adjusted Selling, General and Administrative (SG&A) expense ratio (SG&A expenses as a
percent of premiums and administrative services fees) held steady at 15.3 percent, equivalent to that for 2001,
with the productivity gains described above offsetting a business mix shift that, without them, would have
resulted in an increase.
Our 2002 cash flows provided by operations doubled over that for 2001, further demonstrating the impact of
this year’s operational improvements.
A Proven Strategy for a Breakthrough Opportunity
These results are a tribute to the commitment and expertise of Humana’s associates, who are dedicated to
offering “Guidance when you need it most” in a way that sets the pace for our industry. Within an employer-
driven strategy – offering both traditional and innovative plan options – we’re pursuing our consumer-centric
value proposition with five strategic intents:
—Penetrate high-potential commercial segments: Target appropriate employers for case acquisition and
retention to increase commercial market share and margins.