Humana 2002 Annual Report Download - page 41
Download and view the complete annual report
Please find page 41 of the 2002 Humana annual report below. You can navigate through the pages in the report by either clicking on the pages listed below, or by using the keyword search tool below to find specific information within the annual report.-
 1
1 -
2
-
3
-
4
-
5
-
6
-
7
-
8
-
9
-
10
-
11
-
12
-
13
-
14
-
15
-
16
-
17
-
18
-
19
-
20
-
21
-
22
-
23
-
24
-
25
-
26
-
27
-
28
-
29
-
30
-
 31
31 -
 32
32 -
 33
33 -
 34
34 -
 35
35 -
 36
36 -
 37
37 -
 38
38 -
 39
39 -
 40
40 -
 41
41 -
 42
42 -
 43
43 -
 44
44 -
 45
45 -
 46
46 -
 47
47 -
 48
48 -
 49
49 -
 50
50 -
 51
51 -
52
-
53
-
54
-
55
-
56
-
57
-
58
-
59
-
60
-
61
-
62
-
63
-
64
-
65
-
66
-
67
-
68
-
69
-
70
-
71
-
72
-
73
-
74
-
75
-
76
-
77
-
78
-
79
-
80
-
81
-
82
-
83
-
84
-
85
-
86
-
87
-
88
-
89
-
90
-
91
-
92
-
93
-
94
-
95
-
96
-
97
-
98
-
99
-
100
-
101
-
102
-
103
-
104
-
105
-
106
-
107
-
108
 |
 |

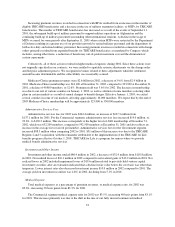
Income Taxes
Our effective tax rate in 2002 of 32% decreased 4% compared to the 36% effective tax rate in 2001. The
lower effective tax rate in 2002 primarily resulted from the cessation of non-deductible goodwill amortization on
January 1, 2002, partially offset by higher state income taxes and a lower proportion of tax-exempt investment
income to pretax income. In addition, during 2002, the Internal Revenue Service completed their audit of all open
years prior to 2000 which resulted in a favorable adjustment to the estimated accrual for income taxes of
approximately $32.6 million. This was offset by an increase of approximately $24.5 million in the capital loss
valuation allowance after we reevaluated probable capital gain realization in the allowable carryforward period
based upon our capital gain experience beginning in 2000 and consideration of alternative tax planning strategies.
See Note 6 to the consolidated financial statements for a complete reconciliation to the federal statutory rate. We
expect the effective tax rate for 2003 to increase to approximately 36% as a result of a lower proportion of tax-
exempt investment income to pretax income and because we are not currently anticipating any favorable
adjustments resulting from the completion of any IRS tax examinations during 2003.
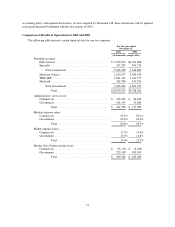
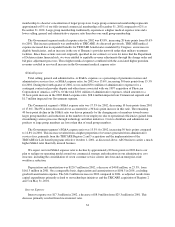
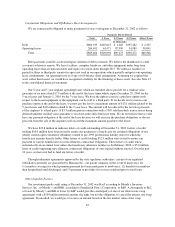
Comparison of Results of Operations for 2001 and 2000
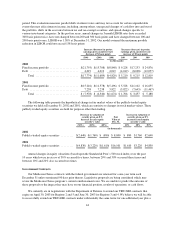
The following table presents certain financial data for our two segments:
For the year ended
December 31,
2001 2000
(in thousands, except ratios)
Premium revenues:
Fullyinsured ..................................... $4,941,888 $ 5,263,602
Specialty ........................................ 304,714 291,315
Total Commercial ............................. 5,246,602 5,554,917
Medicare+Choice ................................. 2,909,478 3,286,351
TRICARE ....................................... 1,341,557 892,375
Medicaid ........................................ 441,324 660,988
TotalGovernment ............................. 4,692,359 4,839,714
Total ................................... $9,938,961 $10,394,631
Administrative services fees:
Commercial ...................................... $ 84,204 $ 86,298
Government ...................................... 52,886 —
Total ................................... $ 137,090 $ 86,298
Medical expense ratios:
Commercial ...................................... 83.1% 83.6%
Government ...................................... 83.6% 85.5%
Total ................................... 83.3% 84.5%
SG&A expense ratios:
Commercial ...................................... 17.6% 17.2%
Government ...................................... 12.8% 11.5%
Total ................................... 15.3% 14.5%
Income (loss) before income taxes:
Commercial ...................................... $ (2,013) $ (7,954)
Government ...................................... 185,093 121,944
Total ................................... $ 183,080 $ 113,990
35