Humana 2002 Annual Report Download - page 38
Download and view the complete annual report
Please find page 38 of the 2002 Humana annual report below. You can navigate through the pages in the report by either clicking on the pages listed below, or by using the keyword search tool below to find specific information within the annual report.-
 1
1 -
2
-
3
-
4
-
5
-
6
-
7
-
8
-
9
-
10
-
11
-
12
-
13
-
14
-
15
-
16
-
17
-
18
-
19
-
20
-
21
-
22
-
23
-
24
-
25
-
26
-
27
-
 28
28 -
 29
29 -
 30
30 -
 31
31 -
 32
32 -
 33
33 -
 34
34 -
 35
35 -
 36
36 -
 37
37 -
 38
38 -
 39
39 -
 40
40 -
 41
41 -
 42
42 -
 43
43 -
 44
44 -
 45
45 -
 46
46 -
 47
47 -
 48
48 -
49
-
50
-
51
-
52
-
53
-
54
-
55
-
56
-
57
-
58
-
59
-
60
-
61
-
62
-
63
-
64
-
65
-
66
-
67
-
68
-
69
-
70
-
71
-
72
-
73
-
74
-
75
-
76
-
77
-
78
-
79
-
80
-
81
-
82
-
83
-
84
-
85
-
86
-
87
-
88
-
89
-
90
-
91
-
92
-
93
-
94
-
95
-
96
-
97
-
98
-
99
-
100
-
101
-
102
-
103
-
104
-
105
-
106
-
107
-
108
 |
 |

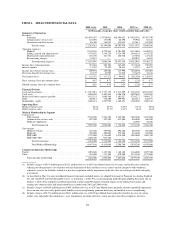
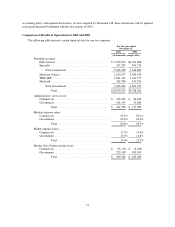
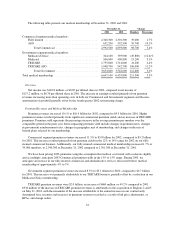
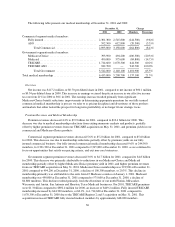
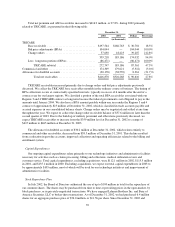
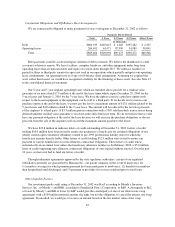
The following table presents our medical membership at December 31, 2002 and 2001:
December 31, Change
2002 2001 Members Percentage
Commercial segment medical members:
Fullyinsured ...................................... 2,340,300 2,301,300 39,000 1.7%
ASO............................................. 652,200 592,500 59,700 10.1%
Total Commercial .............................. 2,992,500 2,893,800 98,700 3.4%
Government segment medical members:
Medicare+Choice .................................. 344,100 393,900 (49,800) (12.6)%
Medicaid ......................................... 506,000 490,800 15,200 3.1%
TRICARE ........................................ 1,755,800 1,714,600 41,200 2.4%
TRICARE ASO .................................... 1,048,700 942,700 106,000 11.2%
TotalGovernment .............................. 3,654,600 3,542,000 112,600 3.2%
Total medical membership ............................... 6,647,100 6,435,800 211,300 3.3%
Overview
Net income was $142.8 million, or $0.85 per diluted share in 2002, compared to net income of
$117.2 million, or $0.70 per diluted share in 2001. The increase in earnings resulted primarily from premium
revenues increasing more than operating costs in both our Commercial and Government segments and the non-
amortization of goodwill partially offset by the fourth quarter 2002 restructuring charge.
Premium Revenues and Medical Membership
Premium revenues increased 10.1% to $10.9 billion for 2002, compared to $9.9 billion for 2001. Higher
premium revenues resulted primarily from significant commercial premium yields and an increase in TRICARE
premiums. Premium yield represents the percentage increase in the average premium per member over the
comparable period in the prior year. Items impacting premium yield include changes in premium rates, changes
in government reimbursement rates, changes in geographic mix of membership, and changes in the mix of
benefit plans selected by our membership.
Commercial segment premium revenues increased 11.5% to $5.8 billion for 2002, compared to $5.2 billion
for 2001. This increase resulted primarily from premium yields in the 12% to 14% range for 2002 on our fully
insured commercial business. Additionally, our fully insured commercial medical membership increased 1.7% or
39,000 members, to 2,340,300 at December 31, 2002 compared to 2,301,300 at December 31, 2001.
We have been pricing 2003 premiums using the assumption that medical cost trends will accelerate slightly
and accordingly, anticipate 2003 Commercial premium yields in the 13% to 15% range. During 2003, we
anticipate an increase in our fully insured commercial and administrative services (discussed below) medical
membership of approximately 4% to 5%.
Government segment premium revenues increased 8.5% to $5.1 billion for 2002, compared to $4.7 billion
for 2001. This increase was primarily attributable to our TRICARE business, partially offset by a reduction in our
Medicare+Choice membership.
TRICARE premium revenues were $2.0 billion, an increase of $660 million, or 49.2% compared to 2001.
$334 million of the increase in TRICARE premium revenues is attributable to the acquisition of Regions 2 and 5
on May 31, 2001, with the remainder of the increase attributable to the annual increase in our contractually
determined base revenues and increases in premium revenues recorded as a result of bid price adjustments, or
BPAs, and change orders.
32