Humana 2002 Annual Report Download - page 89
Download and view the complete annual report
Please find page 89 of the 2002 Humana annual report below. You can navigate through the pages in the report by either clicking on the pages listed below, or by using the keyword search tool below to find specific information within the annual report.-
 1
1 -
2
-
3
-
4
-
5
-
6
-
7
-
8
-
9
-
10
-
11
-
12
-
13
-
14
-
15
-
16
-
17
-
18
-
19
-
20
-
21
-
22
-
23
-
24
-
25
-
26
-
27
-
28
-
29
-
30
-
31
-
32
-
33
-
34
-
35
-
36
-
37
-
38
-
39
-
40
-
41
-
42
-
43
-
44
-
45
-
46
-
47
-
48
-
49
-
50
-
51
-
52
-
53
-
54
-
55
-
56
-
57
-
58
-
59
-
60
-
61
-
62
-
63
-
64
-
65
-
66
-
67
-
68
-
69
-
70
-
71
-
72
-
73
-
74
-
75
-
76
-
77
-
78
-
 79
79 -
 80
80 -
 81
81 -
 82
82 -
 83
83 -
 84
84 -
 85
85 -
 86
86 -
 87
87 -
 88
88 -
 89
89 -
 90
90 -
 91
91 -
 92
92 -
 93
93 -
 94
94 -
 95
95 -
 96
96 -
 97
97 -
 98
98 -
 99
99 -
100
-
101
-
102
-
103
-
104
-
105
-
106
-
107
-
108
 |
 |

Humana Inc.
NOTES TO CONSOLIDATED FINANCIAL STATEMENTS—(Continued)
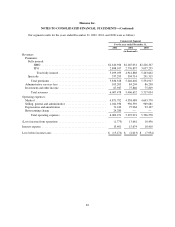
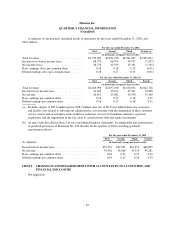
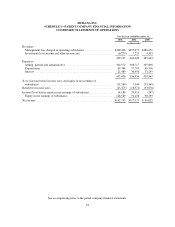
Government Segment
For the year ended December 31,
2002 2001 2000
(in thousands)
Revenues:
Premiums:
Medicare+Choice ....................................... $2,629,597 $2,909,478 $3,286,351
TRICARE ............................................. 2,001,474 1,341,557 892,375
Medicaid .............................................. 462,998 441,324 660,988
Totalpremiums ....................................... 5,094,069 4,692,359 4,839,714
Administrative services fees ................................. 141,193 52,886 —
Investment and other income ................................ 18,441 42,989 39,202
Totalrevenues ........................................ 5,253,703 4,788,234 4,878,916
Operating expenses:
Medical ............................................... 4,266,404 3,921,356 4,138,228
Selling, general and administrative .......................... 697,256 608,590 555,118
Depreciation and amortization ............................. 49,487 63,567 53,421
Restructuring charge ..................................... 11,597 — —
Total operating expenses ................................ 5,024,744 4,593,513 4,746,767
Income from operations ...................................... 228,959 194,721 132,149
Interest expense ............................................. 3,851 9,628 10,205
Incomebeforeincometaxes ................................... $ 225,108 $ 185,093 $ 121,944
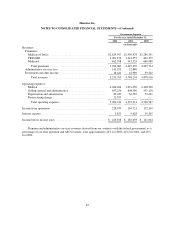
Premium and administrative services revenues derived from our contracts with the federal government, as a
percentage of our total premium and ASO revenues, were approximately 44% for 2002, 44% for 2001, and 42%
for 2000.
83