Humana 2002 Annual Report Download - page 70
Download and view the complete annual report
Please find page 70 of the 2002 Humana annual report below. You can navigate through the pages in the report by either clicking on the pages listed below, or by using the keyword search tool below to find specific information within the annual report.-
 1
1 -
2
-
3
-
4
-
5
-
6
-
7
-
8
-
9
-
10
-
11
-
12
-
13
-
14
-
15
-
16
-
17
-
18
-
19
-
20
-
21
-
22
-
23
-
24
-
25
-
26
-
27
-
28
-
29
-
30
-
31
-
32
-
33
-
34
-
35
-
36
-
37
-
38
-
39
-
40
-
41
-
42
-
43
-
44
-
45
-
46
-
47
-
48
-
49
-
50
-
51
-
52
-
53
-
54
-
55
-
56
-
57
-
58
-
59
-
 60
60 -
 61
61 -
 62
62 -
 63
63 -
 64
64 -
 65
65 -
 66
66 -
 67
67 -
 68
68 -
 69
69 -
 70
70 -
 71
71 -
 72
72 -
 73
73 -
 74
74 -
 75
75 -
 76
76 -
 77
77 -
 78
78 -
 79
79 -
 80
80 -
81
-
82
-
83
-
84
-
85
-
86
-
87
-
88
-
89
-
90
-
91
-
92
-
93
-
94
-
95
-
96
-
97
-
98
-
99
-
100
-
101
-
102
-
103
-
104
-
105
-
106
-
107
-
108
 |
 |

Humana Inc.
NOTES TO CONSOLIDATED FINANCIAL STATEMENTS—(Continued)
Investment securities classified as long-term assets at December 31, 2002 and 2001 included the following:
2002 2001
Amortized
Cost
Gross
Unrealized
Gains
Gross
Unrealized
Losses
Fair
Value
Amortized
Cost
Gross
Unrealized
Gains
Gross
Unrealized
Losses
Fair
Value
(in thousands)
U.S.Governmentobligations .... $ 32,620 $ 409 $ — $ 33,029 $ 31,906 $ 8 $ (218) $ 31,696
Tax exempt municipal
securities .................. 131,353 3,887 (215) 135,025 65,877 727 (874) 65,730
Corporate and other securities .... 56,296 1,277 (396) 57,177 75,633 717 (1,550) 74,800
Mortgage-backed securities ..... 15,837 27 — 15,864 22,449 — — 22,449
Redeemable preferred stocks .... 31,625 7,377 — 39,002 48,387 22,001 (92) 70,296
Debt securities ............ 267,731 12,977 (611) 280,097 244,252 23,453 (2,734) 264,971
Equity securities .............. 9,828 35 (1,236) 8,627 21,764 25 (637) 21,152
Long-term investment
securities .............. $277,559 $13,012 $(1,847) $288,724 $266,016 $23,478 $(3,371) $286,123
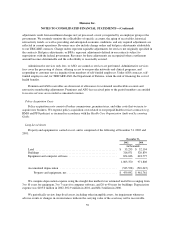
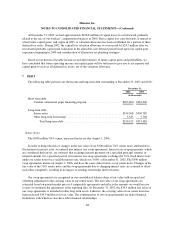
The contractual maturities of debt securities available for sale at December 31, 2002, regardless of their
balance sheet classification, are shown below. Expected maturities may differ from contractual maturities
because borrowers may have the right to call or prepay obligations with or without call or prepayment penalties.
Amortized
Cost
Fair
Value
(in thousands)
Duewithinoneyear .................................... $ 125,247 $ 125,094
Due after one year through five years ....................... 478,336 495,043
Due after five years through ten years ...................... 333,076 340,000
Due after ten years ...................................... 659,259 677,325
Total debt securities ................................ $1,595,918 $1,637,461
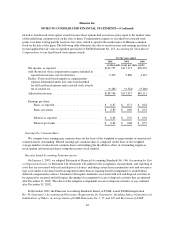
Gross realized investment gains were $24.7 million in 2002, $25.1 million in 2001 and $8.1 million in 2000.
Gross realized investment losses were $34.8 million in 2002, $11.2 million in 2001, and $1.5 million in 2000.
Gross realized losses in 2002 included impairment losses of $19.6 million related to privately held investment
securities after an evaluation indicated that a decline in fair value below the cost basis was other than temporary.
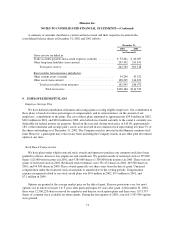
Beginning in the fourth quarter of 2002 we began participation in a securities lending program where we
loan certain investment securities for short periods of time in exchange for collateral, consisting of cash or
U.S. Government securities, equal to at least 102% of the fair value of the investment securities on loan. As of
December 31, 2002, investment securities with a fair value of $88.1 million were on loan. Investment income
earned on security lending transactions for 2002 was less than $0.1 million.
64