Humana 2002 Annual Report Download - page 37
Download and view the complete annual report
Please find page 37 of the 2002 Humana annual report below. You can navigate through the pages in the report by either clicking on the pages listed below, or by using the keyword search tool below to find specific information within the annual report.-
 1
1 -
2
-
3
-
4
-
5
-
6
-
7
-
8
-
9
-
10
-
11
-
12
-
13
-
14
-
15
-
16
-
17
-
18
-
19
-
20
-
21
-
22
-
23
-
24
-
25
-
26
-
 27
27 -
 28
28 -
 29
29 -
 30
30 -
 31
31 -
 32
32 -
 33
33 -
 34
34 -
 35
35 -
 36
36 -
 37
37 -
 38
38 -
 39
39 -
 40
40 -
 41
41 -
 42
42 -
 43
43 -
 44
44 -
 45
45 -
 46
46 -
 47
47 -
48
-
49
-
50
-
51
-
52
-
53
-
54
-
55
-
56
-
57
-
58
-
59
-
60
-
61
-
62
-
63
-
64
-
65
-
66
-
67
-
68
-
69
-
70
-
71
-
72
-
73
-
74
-
75
-
76
-
77
-
78
-
79
-
80
-
81
-
82
-
83
-
84
-
85
-
86
-
87
-
88
-
89
-
90
-
91
-
92
-
93
-
94
-
95
-
96
-
97
-
98
-
99
-
100
-
101
-
102
-
103
-
104
-
105
-
106
-
107
-
108
 |
 |

accounting policy and required disclosures. As now required by Statement 148, these disclosures will be updated
each reporting period beginning with the first quarter of 2003.
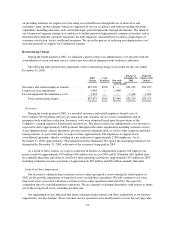
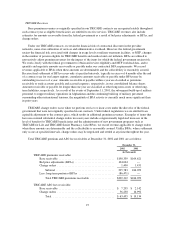
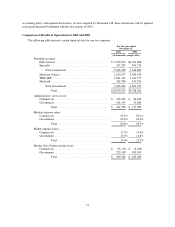
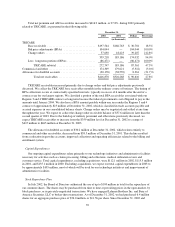
Comparison of Results of Operations for 2002 and 2001
The following table presents certain financial data for our two segments:
For the year ended
December 31,
2002 2001
(in thousands, except ratios)
Premium revenues:
Fullyinsured ..................................... $ 5,499,033 $4,941,888
Specialty ........................................ 337,295 304,714
Total Commercial ............................. 5,836,328 5,246,602
Medicare+Choice ................................. 2,629,597 2,909,478
TRICARE ....................................... 2,001,474 1,341,557
Medicaid ........................................ 462,998 441,324
TotalGovernment ............................. 5,094,069 4,692,359
Total ................................... $10,930,397 $9,938,961
Administrative services fees:
Commercial ...................................... $ 103,203 $ 84,204
Government ...................................... 141,193 52,886
Total ................................... $ 244,396 $ 137,090
Medical expense ratios:
Commercial ...................................... 83.5% 83.1%
Government ...................................... 83.8% 83.6%
Total ................................... 83.6% 83.3%
SG&A expense ratios:
Commercial ...................................... 17.5% 17.6%
Government ...................................... 13.3% 12.8%
Total ................................... 15.6% 15.3%
Income (loss) before income taxes:
Commercial ...................................... $ (15,174) $ (2,013)
Government ...................................... 225,108 185,093
Total ................................... $ 209,934 $ 183,080
31