Humana 2002 Annual Report Download - page 44
Download and view the complete annual report
Please find page 44 of the 2002 Humana annual report below. You can navigate through the pages in the report by either clicking on the pages listed below, or by using the keyword search tool below to find specific information within the annual report.-
 1
1 -
2
-
3
-
4
-
5
-
6
-
7
-
8
-
9
-
10
-
11
-
12
-
13
-
14
-
15
-
16
-
17
-
18
-
19
-
20
-
21
-
22
-
23
-
24
-
25
-
26
-
27
-
28
-
29
-
30
-
31
-
32
-
33
-
 34
34 -
 35
35 -
 36
36 -
 37
37 -
 38
38 -
 39
39 -
 40
40 -
 41
41 -
 42
42 -
 43
43 -
 44
44 -
 45
45 -
 46
46 -
 47
47 -
 48
48 -
 49
49 -
 50
50 -
 51
51 -
 52
52 -
 53
53 -
 54
54 -
55
-
56
-
57
-
58
-
59
-
60
-
61
-
62
-
63
-
64
-
65
-
66
-
67
-
68
-
69
-
70
-
71
-
72
-
73
-
74
-
75
-
76
-
77
-
78
-
79
-
80
-
81
-
82
-
83
-
84
-
85
-
86
-
87
-
88
-
89
-
90
-
91
-
92
-
93
-
94
-
95
-
96
-
97
-
98
-
99
-
100
-
101
-
102
-
103
-
104
-
105
-
106
-
107
-
108
 |
 |

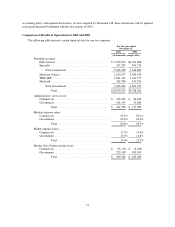
Income Taxes
Our effective tax rate in 2001 was approximately 36% compared to a 21% effective tax rate in 2000. The
lower effective tax rate in 2000 was the result of recognizing the benefit of capital loss carryforwards resulting
from the sale of our workers’ compensation business.
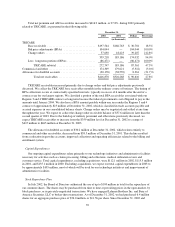
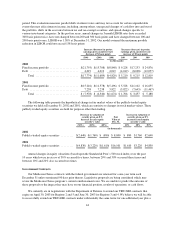
Liquidity
The following table presents operating cash flows for the years ended December 31, 2002 and 2001,
excluding the effects of the timing of the Medicare+Choice premium receipts:
For the years ended,
2002 2001
(in thousands)
Cash flows provided by operating activities ..................................... $321,408 $148,958
Timing of Medicare+Choice premium receipts .................................. 10,873 16,815
Normalized cash flows provided by operating activities ....................... $332,281 $165,773
The Medicare+Choice premium receipt is payable to us on the first day of each month. When the first day of
a month falls on a weekend or holiday, we receive this payment at the end of the previous month. This receipt is
significant, the timing of which can cause material fluctuation in operating cash flows. Normalized operating
cash flows assume these monthly receipts were received in the month in which they are applicable, providing a
better comparison.
Normalized operating cash flows were $332.3 million in 2002, compared to $165.8 million in 2001, an
increase of $166.5 million. This increase primarily was attributable to higher net income and an increase in
medical and other expenses payable partially offset by higher TRICARE receivables. Medical and other expenses
payable increased $55.7 million during 2002, primarily as a result of membership growth, the timing of our
payment to our third-party pharmacy benefit administrator, and increases in medical claims trend partially offset
by a reduction in unprocessed claim inventories and a decrease in claim receipt cycle time. Medical and other
expenses payable declined $179.5 million during 2001 due to reductions in both unprocessed claim inventories
on-hand and membership levels.
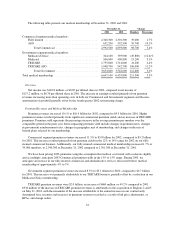
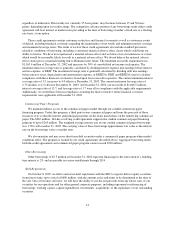
Throughout 2001, and to a lesser extent during 2002, we reduced the level of unprocessed claim inventories,
a direct result of our focused effort to improve service and operational efficiencies. The pace of claim inventory
reduction slowed during 2002 to $33.1 million compared to $132.0 million for 2001. The following table
presents the estimated valuation and number of unprocessed claims on hand. Claims on hand represent the
estimated number of provider requests for reimbursement that have been received but not yet processed.
Estimated
Valuation
Claims
On Hand
Number of
Days Claims
On-hand
(in thousands)
December 31, 2000 ............................................. $257,400 1,157,900 11.0
December 31, 2001 ............................................. $125,400 518,100 5.0
December 31, 2002 ............................................. $ 92,300 424,200 4.1
38