Humana 2002 Annual Report Download - page 28
Download and view the complete annual report
Please find page 28 of the 2002 Humana annual report below. You can navigate through the pages in the report by either clicking on the pages listed below, or by using the keyword search tool below to find specific information within the annual report.-
 1
1 -
2
-
3
-
4
-
5
-
6
-
7
-
8
-
9
-
10
-
11
-
12
-
13
-
14
-
15
-
16
-
17
-
 18
18 -
 19
19 -
 20
20 -
 21
21 -
 22
22 -
 23
23 -
 24
24 -
 25
25 -
 26
26 -
 27
27 -
 28
28 -
 29
29 -
 30
30 -
 31
31 -
 32
32 -
 33
33 -
 34
34 -
 35
35 -
 36
36 -
 37
37 -
 38
38 -
39
-
40
-
41
-
42
-
43
-
44
-
45
-
46
-
47
-
48
-
49
-
50
-
51
-
52
-
53
-
54
-
55
-
56
-
57
-
58
-
59
-
60
-
61
-
62
-
63
-
64
-
65
-
66
-
67
-
68
-
69
-
70
-
71
-
72
-
73
-
74
-
75
-
76
-
77
-
78
-
79
-
80
-
81
-
82
-
83
-
84
-
85
-
86
-
87
-
88
-
89
-
90
-
91
-
92
-
93
-
94
-
95
-
96
-
97
-
98
-
99
-
100
-
101
-
102
-
103
-
104
-
105
-
106
-
107
-
108
 |
 |

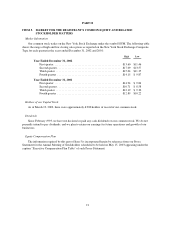
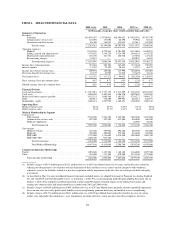
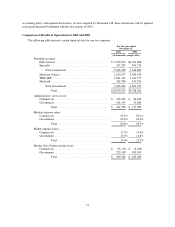
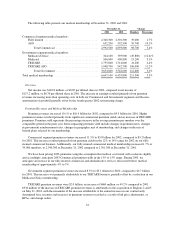
ITEM 6. SELECTED FINANCIAL DATA
2002 (a)(b) 2001 2000 1999 (c) 1998 (d)
(in thousands, except per share results, membership and ratios)
Summary of Operations
Revenues:
Premiums ........................................ $10,930,397 $ 9,938,961 $10,394,631 $ 9,958,582 $9,597,749
Administrative services fees ......................... 244,396 137,090 86,298 97,940 84,546
Investment and other income ......................... 86,388 118,835 115,021 155,013 183,885
Totalrevenues ................................ 11,261,181 10,194,886 10,595,950 10,211,535 9,866,180
Operating expenses:
Medical ......................................... 9,138,196 8,279,844 8,781,998 8,533,090 8,040,951
Selling, general and administrative .................... 1,739,192 1,545,129 1,524,799 1,466,181 1,413,329
Depreciation and amortization ........................ 120,730 161,531 146,548 123,858 127,662
Restructuring charges ............................... 35,877 — — 459,852 34,183
Total operating expenses ........................ 11,033,995 9,986,504 10,453,345 10,582,981 9,616,125
Income (loss) from operations ............................ 227,186 208,382 142,605 (371,446) 250,055
Interest expense ....................................... 17,252 25,302 28,615 33,393 46,972
Income(loss)beforeincometaxes......................... 209,934 183,080 113,990 (404,839) 203,083
Provision (benefit) for income taxes ....................... 67,179 65,909 23,938 (22,419) 74,126
Netincome(loss) ...................................... $ 142,755 $ 117,171 $ 90,052 $ (382,420) $ 128,957
Basic earnings (loss) per common share .................... $ 0.87 $ 0.71 $ 0.54 $ (2.28) $ 0.77
Diluted earnings (loss) per common share ................... $ 0.85 $ 0.70 $ 0.54 $ (2.28) $ 0.77
Financial Position
Cash and investments ................................... $ 2,415,914 $ 2,327,139 $ 2,312,399 $ 2,785,702 $2,851,007
Total assets ........................................... 4,600,030 4,403,638 4,306,978 4,899,845 5,495,605
Medical and other expenses payable ....................... 1,142,131 1,086,386 1,181,027 1,756,227 1,908,175
Debt ................................................ 604,913 578,489 599,952 686,213 822,977
Stockholders’ equity ................................... 1,606,474 1,507,949 1,360,421 1,268,009 1,688,363
Operating Data
Medical expense ratio .................................. 83.6% 83.3% 84.5% 85.7% 83.8%
SG&A expense ratio ................................... 15.6% 15.3% 14.5% 14.6% 14.6%
Medical Membership by Segment
Commercial:
Fullyinsured ..................................... 2,340,300 2,301,300 2,545,800 3,083,600 3,261,500
Administrative services only ......................... 652,200 592,500 612,800 648,000 646,200
Medicare supplement ............................... — — — 44,500 56,600
Total Commercial ............................. 2,992,500 2,893,800 3,158,600 3,776,100 3,964,300
Government:
Medicare+Choice .................................. 344,100 393,900 494,200 488,500 502,000
Medicaid ........................................ 506,000 490,800 575,600 616,600 643,800
TRICARE ....................................... 1,755,800 1,714,600 1,070,300 1,058,000 1,085,700
TRICARE ASO ................................... 1,048,700 942,700 — — —
TotalGovernment ............................. 3,654,600 3,542,000 2,140,100 2,163,100 2,231,500
Total Medical Membership ...................... 6,647,100 6,435,800 5,298,700 5,939,200 6,195,800
Commercial Specialty Membership
Dental............................................... 1,094,600 1,123,300 1,148,100 1,146,000 1,027,300
Other ............................................... 545,400 571,300 678,900 1,333,100 1,257,800
Total specialty membership .......................... 1,640,000 1,694,600 1,827,000 2,479,100 2,285,100
(a) Includes charges of $85.6 million pretax ($58.2 million after tax, or $0.35 per diluted share) for severance and facility costs related to
reducing our administrative cost structure with the elimination of three customer service centers and an enterprise-wide workforce
reduction, reserves for liabilities related to a previous acquisition and the impairment in the fair value of certain private debt and equity
investments.
(b) As described in Note 2 to our consolidated financial statements included herein, we adopted Statement of Financial Accounting Standard
No. 142, Goodwill and Other Intangible Assets, as of January 1, 2002. We ceased amortizing goodwill upon adopting Statement 142 on
January 1, 2002. Note 4 identifies goodwill amortized in 2001 and 2000 and the estimated impact on our reported net income and
earnings per common share had amortization been excluded from 2001 and 2000 results.
(c) Includes charges of $584.8 million pretax ($499.3 million after tax, or $2.97 per diluted share) primarily related to goodwill impairment,
losses on non-core asset sales, professional liability reserve strengthening, premium deficiency and medical reserve strengthening.
(d) Includes charges of $132.4 million pretax ($84.1 million after tax, or $0.50 per diluted share) primarily related to the costs of certain
market exits and product discontinuances, asset impairments, premium deficiency and a one-time non-officer employee incentive.
22