Humana 2002 Annual Report Download - page 42
Download and view the complete annual report
Please find page 42 of the 2002 Humana annual report below. You can navigate through the pages in the report by either clicking on the pages listed below, or by using the keyword search tool below to find specific information within the annual report.-
 1
1 -
2
-
3
-
4
-
5
-
6
-
7
-
8
-
9
-
10
-
11
-
12
-
13
-
14
-
15
-
16
-
17
-
18
-
19
-
20
-
21
-
22
-
23
-
24
-
25
-
26
-
27
-
28
-
29
-
30
-
31
-
 32
32 -
 33
33 -
 34
34 -
 35
35 -
 36
36 -
 37
37 -
 38
38 -
 39
39 -
 40
40 -
 41
41 -
 42
42 -
 43
43 -
 44
44 -
 45
45 -
 46
46 -
 47
47 -
 48
48 -
 49
49 -
 50
50 -
 51
51 -
 52
52 -
53
-
54
-
55
-
56
-
57
-
58
-
59
-
60
-
61
-
62
-
63
-
64
-
65
-
66
-
67
-
68
-
69
-
70
-
71
-
72
-
73
-
74
-
75
-
76
-
77
-
78
-
79
-
80
-
81
-
82
-
83
-
84
-
85
-
86
-
87
-
88
-
89
-
90
-
91
-
92
-
93
-
94
-
95
-
96
-
97
-
98
-
99
-
100
-
101
-
102
-
103
-
104
-
105
-
106
-
107
-
108
 |
 |

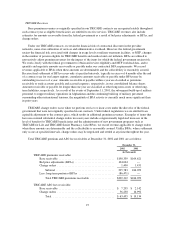
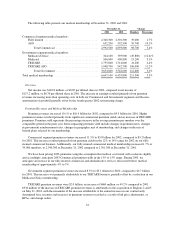
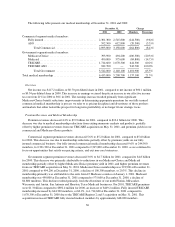
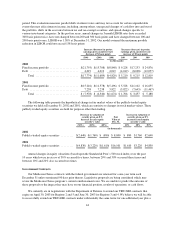
The following table presents our medical membership at December 31, 2001 and 2000:
December 31, Change
2001 2000 Members Percentage
Commercial segment medical members:
Fullyinsured..................................... 2,301,300 2,545,800 (244,500) (9.6)%
ASO ........................................... 592,500 612,800 (20,300) (3.3)%
Total Commercial ............................. 2,893,800 3,158,600 (264,800) (8.4)%
Government segment medical members:
Medicare+Choice ................................. 393,900 494,200 (100,300) (20.3)%
Medicaid ........................................ 490,800 575,600 (84,800) (14.7)%
TRICARE ....................................... 1,714,600 1,070,300 644,300 60.2%
TRICARE ASO .................................. 942,700 — 942,700 100.0%
TotalGovernment ............................ 3,542,000 2,140,100 1,401,900 65.5%
Total medical membership .............................. 6,435,800 5,298,700 1,137,100 21.5%
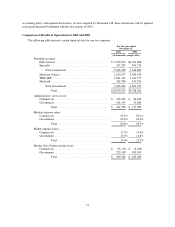
Overview
Net income was $117.2 million, or $0.70 per diluted share in 2001, compared to net income of $90.1 million,
or $0.54 per diluted share in 2000. This increase in earnings occurred despite an increase in our effective income
tax rate from 21% in 2000 to 36% in 2001. The earnings increase resulted primarily from significant
Medicare+Choice benefit reductions, improvements in determining appropriate premiums for our fully insured
commercial medical membership (a process we refer to as pricing discipline) and divestitures of those products
and markets that either lacked the prospect for long-term profitability or no longer fit our strategic focus.
Premium Revenues and Medical Membership
Premium revenues decreased 4.4% to $9.9 billion for 2001, compared to $10.4 billion for 2000. This
decrease was due to medical membership reductions from exiting numerous markets and products, partially
offset by higher premium revenues from our TRICARE acquisition on May 31, 2001, and premium yields in our
commercial and Medicare+Choice products.
Commercial segment premium revenues decreased 5.6% to $5.2 billion for 2001, compared to $5.6 billion
for 2000. This decrease was due to membership reductions partially offset by premium yields on our fully
insured commercial business. Our fully insured commercial medical membership decreased 9.6% or 244,500
members, to 2,301,300 at December 31, 2001 compared to 2,545,800 at December 31, 2000, as we continued to
focus on opportunities that satisfy our pricing criteria, and exit non-core businesses.
Government segment premium revenues decreased 3.0% to $4.7 billion for 2001, compared to $4.8 billion
for 2000. This decrease was primarily attributable to reductions in our Medicare+Choice and Medicaid
membership partially offset by higher Medicare+Choice premium yield in 2001, and higher premium revenues
from our TRICARE acquisition on May 31, 2001. Medicare+Choice membership was 393,900 at December 31,
2001 compared to 494,200 at December 31, 2000, a decline of 100,300 members, or 20.3%. This decline in
membership primarily was attributable to the exits from 45 Medicare counties on January 1, 2001. Medicaid
membership was 490,800 at December 31, 2001 compared to 575,600 at December 31, 2000, a decline of
84,800 members. This decline resulted primarily from the divestiture of our north Florida, Milwaukee,
Wisconsin, and Austin, San Antonio and Houston, Texas Medicaid businesses. For 2001, TRICARE premiums
were $1.3 billion compared to $892.4 million for 2000, an increase of $449.2 million. Fully insured TRICARE
membership increased by 644,300 members, or 60.2%, to 1,714,600 at December 31, 2001 compared to
1,070,300 at December 31, 2000 due to the TRICARE Regions 2 and 5 acquisition on May 31, 2001. This
acquisition increased TRICARE fully insured medical members by approximately 648,000 members.
36