Humana 2002 Annual Report Download - page 39
Download and view the complete annual report
Please find page 39 of the 2002 Humana annual report below. You can navigate through the pages in the report by either clicking on the pages listed below, or by using the keyword search tool below to find specific information within the annual report.-
 1
1 -
2
-
3
-
4
-
5
-
6
-
7
-
8
-
9
-
10
-
11
-
12
-
13
-
14
-
15
-
16
-
17
-
18
-
19
-
20
-
21
-
22
-
23
-
24
-
25
-
26
-
27
-
28
-
 29
29 -
 30
30 -
 31
31 -
 32
32 -
 33
33 -
 34
34 -
 35
35 -
 36
36 -
 37
37 -
 38
38 -
 39
39 -
 40
40 -
 41
41 -
 42
42 -
 43
43 -
 44
44 -
 45
45 -
 46
46 -
 47
47 -
 48
48 -
 49
49 -
50
-
51
-
52
-
53
-
54
-
55
-
56
-
57
-
58
-
59
-
60
-
61
-
62
-
63
-
64
-
65
-
66
-
67
-
68
-
69
-
70
-
71
-
72
-
73
-
74
-
75
-
76
-
77
-
78
-
79
-
80
-
81
-
82
-
83
-
84
-
85
-
86
-
87
-
88
-
89
-
90
-
91
-
92
-
93
-
94
-
95
-
96
-
97
-
98
-
99
-
100
-
101
-
102
-
103
-
104
-
105
-
106
-
107
-
108
 |
 |
Increasing premium revenues recorded in connection with BPAs resulted from an increase in the number of
eligible TRICARE beneficiaries and a decrease in the use of military treatment facilities, or MTFs, by TRICARE
beneficiaries. The number of TRICARE beneficiaries has increased as a result of the events of September 11,
2001, the subsequent build-up of military personnel to support military operations in Afghanistan and the
continuing build-up of military personnel surrounding other international tensions. A decline in the usage of
MTFs occurred for some periods after September 11, 2001 when certain MTFs were restricted by the Department
of Defense resulting in a greater use of our provider network by retired military personnel and the dependents of
both active duty and retired military personnel. Increasing premium revenues recorded in connection with change
orders primarily resulted from expanded benefits for TRICARE beneficiaries as mandated by Congress which
includes, among other items, a reduction of beneficiary out-of-pocket maximum cost and the elimination of
certain copayments.
Collectively, all of these actions resulted in higher medical expenses during 2002. Since these actions were
not originally specified in our contracts, we were entitled to equitable revenue adjustments via the change order
and bid price adjustment process. We recognized revenues related to these adjustments when the settlement
amount became determinable and the collectibility was reasonably assured.
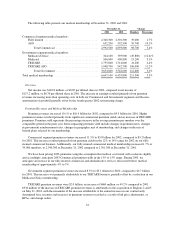
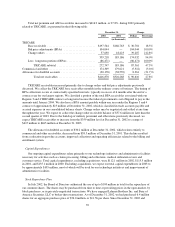
Medicare+Choice premium revenues were $2.6 billion in 2002, a decrease of 9.6% from $2.9 billion in
2001. Medicare+Choice membership was 344,100 at December 31, 2002, compared to 393,900 at December 31,
2001, a decline of 49,800 members, or 12.6%. Premium yield was 5.6% for 2002. The decrease in membership
was due to our exit of various counties on January 1, 2002, as well as attrition of some members selecting other
plans in certain markets as a result of annual changes to benefit designs. Effective January 1, 2003, we exited
several counties in some of our markets, affecting approximately 10,000 members. We expect that by the end of
2003 Medicare+Choice membership will be approximately 325,000 to 330,000 members.
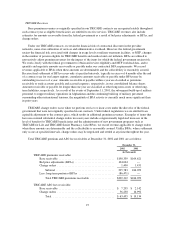
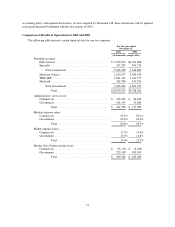
Administrative Services Fees
Administrative services fees for 2002 were $244.4 million, an increase of $107.3 million from
$137.1 million for 2001. For the Commercial segment, administrative services fees increased $19.0 million, or
22.6%, to $103.2 million. This increase corresponds to the higher level of ASO membership at December 31,
2002, which was 652,200 members, compared to 592,500 members at December 31, 2001 and also reflects an
increase in the average fees received per member. Administrative services fees for the Government segment
increased $88.3 million when comparing 2002 to 2001. $51 million of this increase was due to the TRICARE
Regions 2 and 5 acquisition, with the remainder attributable to the implementation of the TRICARE for Life
benefits program effective October 1, 2001. TRICARE for Life is a program for seniors where we provide
medical benefit administrative services.
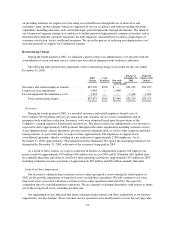
Investment and Other Income
Investment and other income totaled $86.4 million in 2002, a decrease of $32.4 million from $118.8 million
in 2001. Net realized losses of $10.1 million in 2002 compared to net realized gains of $13.9 million in 2001. Net
realized losses in 2002 included impairment losses of $19.6 million related to privately held venture capital
investment securities after an evaluation indicated that a decline in fair value below the cost basis was other than
temporary. Lower interest rates also decreased investment income $10.9 million in 2002 compared to 2001. The
average yield on investment securities was 4.6% in 2002, declining from 5.1% in 2001.
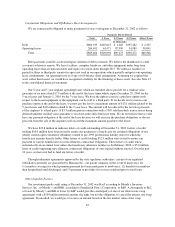
Medical Expense
Total medical expenses as a percentage of premium revenues, or medical expense ratio, for 2002 was
83.6%, increasing 30 basis points from 83.3% for 2001.
The Commercial segment medical expense ratio for 2002 was 83.5%, increasing 40 basis points from 83.1%
for 2001. This increase primarily was due to the shift in the mix of our fully insured commercial medical
33