Humana 2002 Annual Report Download - page 16
Download and view the complete annual report
Please find page 16 of the 2002 Humana annual report below. You can navigate through the pages in the report by either clicking on the pages listed below, or by using the keyword search tool below to find specific information within the annual report.-
 1
1 -
2
-
3
-
4
-
5
-
 6
6 -
 7
7 -
 8
8 -
 9
9 -
 10
10 -
 11
11 -
 12
12 -
 13
13 -
 14
14 -
 15
15 -
 16
16 -
 17
17 -
 18
18 -
 19
19 -
 20
20 -
 21
21 -
 22
22 -
 23
23 -
 24
24 -
 25
25 -
 26
26 -
27
-
28
-
29
-
30
-
31
-
32
-
33
-
34
-
35
-
36
-
37
-
38
-
39
-
40
-
41
-
42
-
43
-
44
-
45
-
46
-
47
-
48
-
49
-
50
-
51
-
52
-
53
-
54
-
55
-
56
-
57
-
58
-
59
-
60
-
61
-
62
-
63
-
64
-
65
-
66
-
67
-
68
-
69
-
70
-
71
-
72
-
73
-
74
-
75
-
76
-
77
-
78
-
79
-
80
-
81
-
82
-
83
-
84
-
85
-
86
-
87
-
88
-
89
-
90
-
91
-
92
-
93
-
94
-
95
-
96
-
97
-
98
-
99
-
100
-
101
-
102
-
103
-
104
-
105
-
106
-
107
-
108
 |
 |

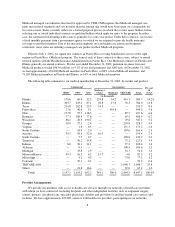
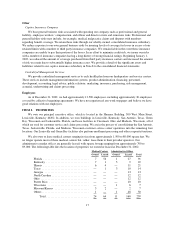
Physicians under these types of arrangements typically have stop loss coverage so that a physician’s
financial risk for any single member is limited to a maximum amount on an annual basis. We remain financially
responsible for health care services to our members in the event our providers fail to provide such services.
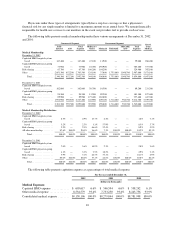
The following table presents medical membership under these various arrangements at December 31, 2002
and 2001:
Commercial Segment Government Segment Consol.
Total
Medical
Fully
Insured ASO
Total
Segment
Medicare+
Choice Medicaid TRICARE
TRICARE
ASO
Total
Segment
Medical Membership:
December 31, 2002
Capitated HMO hospital system
based ................... 147,400 — 147,400 47,100 11,900 — — 59,000 206,400
Capitated HMO physician group
based ................... 73,900 — 73,900 10,700 292,900 — — 303,600 377,500
Risk-sharing ................ 67,700 — 67,700 160,200 164,200 — — 324,400 392,100
Other ..................... 2,051,300 652,200 2,703,500 126,100 37,000 1,755,800 1,048,700 2,967,600 5,671,100
Total.................. 2,340,300 652,200 2,992,500 344,100 506,000 1,755,800 1,048,700 3,654,600 6,647,100
December 31, 2001
Capitated HMO hospital system
based ................... 162,000 — 162,000 58,700 10,500 — — 69,200 231,200
Capitated HMO physician group
based ................... 94,500 — 94,500 13,900 89,200 — — 103,100 197,600
Risk-sharing ................ 89,900 — 89,900 175,400 182,000 — — 357,400 447,300
Other ..................... 1,954,900 592,500 2,547,400 145,900 209,100 1,714,600 942,700 3,012,300 5,559,700
Total.................. 2,301,300 592,500 2,893,800 393,900 490,800 1,714,600 942,700 3,542,000 6,435,800
Medical Membership Distribution:
December 31, 2002
Capitated HMO hospital system
based ................... 6.3% — 4.9% 13.7% 2.4% — — 1.6% 3.1%
Capitated HMO physician group
based ................... 3.2% — 2.5% 3.1% 57.9% — — 8.3% 5.7%
Risk-sharing ................ 2.9% — 2.3% 46.6% 32.4% — — 8.9% 5.9%
All other membership ........ 87.6% 100.0% 90.3% 36.6% 7.3% 100.0% 100.0% 81.2% 85.3%
Total.................. 100.0% 100.0% 100.0% 100.0% 100.0% 100.0% 100.0% 100.0% 100.0%
December 31, 2001
Capitated HMO hospital system
based ................... 7.0% — 5.6% 14.9% 2.1% — — 2.0% 3.6%
Capitated HMO physician group
based ................... 4.1% — 3.3% 3.5% 18.2% — — 2.9% 3.1%
Risk-sharing ................ 3.9% — 3.1% 44.5% 37.1% — — 10.1% 6.9%
Other ..................... 85.0% 100.0% 88.0% 37.1% 42.6% 100.0% 100.0% 85.0% 86.4%
Total.................. 100.0% 100.0% 100.0% 100.0% 100.0% 100.0% 100.0% 100.0% 100.0%
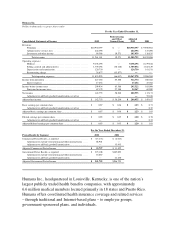
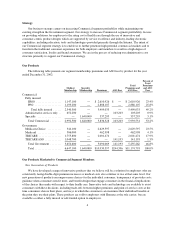
The following table presents capitation expense as a percentage of total medical expense:
For the year ended December 31,
2002 2001 2000
(dollars in thousands)
Medical Expenses:
Capitated HMO expense ............ $ 603,617 6.6% $ 546,594 6.6% $ 538,242 6.1%
Other medical expense .............. 8,534,579 93.4% 7,733,250 93.4% 8,243,756 93.9%
Consolidated medical expense ........ $9,138,196 100.0% $8,279,844 100.0% $8,781,998 100.0%
10