Humana 2002 Annual Report Download - page 43
Download and view the complete annual report
Please find page 43 of the 2002 Humana annual report below. You can navigate through the pages in the report by either clicking on the pages listed below, or by using the keyword search tool below to find specific information within the annual report.-
 1
1 -
2
-
3
-
4
-
5
-
6
-
7
-
8
-
9
-
10
-
11
-
12
-
13
-
14
-
15
-
16
-
17
-
18
-
19
-
20
-
21
-
22
-
23
-
24
-
25
-
26
-
27
-
28
-
29
-
30
-
31
-
32
-
 33
33 -
 34
34 -
 35
35 -
 36
36 -
 37
37 -
 38
38 -
 39
39 -
 40
40 -
 41
41 -
 42
42 -
 43
43 -
 44
44 -
 45
45 -
 46
46 -
 47
47 -
 48
48 -
 49
49 -
 50
50 -
 51
51 -
 52
52 -
 53
53 -
54
-
55
-
56
-
57
-
58
-
59
-
60
-
61
-
62
-
63
-
64
-
65
-
66
-
67
-
68
-
69
-
70
-
71
-
72
-
73
-
74
-
75
-
76
-
77
-
78
-
79
-
80
-
81
-
82
-
83
-
84
-
85
-
86
-
87
-
88
-
89
-
90
-
91
-
92
-
93
-
94
-
95
-
96
-
97
-
98
-
99
-
100
-
101
-
102
-
103
-
104
-
105
-
106
-
107
-
108
 |
 |
Administrative Services Fees
Administrative services fees for 2001 were $137.1 million, an increase of $50.8 million from $86.3 million
for 2000. This increase primarily was due to the TRICARE Regions 2 and 5 acquisition, and servicing medical
benefits in an administrative capacity under a new TRICARE program for seniors, called TRICARE for Life,
which began October 1, 2001.
Investment and Other Income
Investment and other income totaled $118.8 million in 2001, an increase of $3.8 million from
$115.0 million in 2000. The increased investment and other income resulted from higher average invested
balances partially offset by lower interest rates.
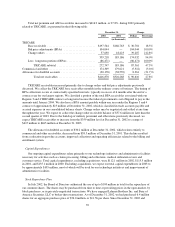
Medical Expense
Total medical expenses as a percentage of premium revenues, or medical expense ratio, for 2001 was
83.3%, decreasing 120 basis points from 84.5% for 2000. The improvement in the medical expense ratio
primarily was due to significant benefit reductions in our Medicare+Choice product effective January 1, 2001,
continued discipline in commercial pricing, and the exit of numerous higher cost markets and products during
2000.
The Commercial segment medical expense ratio for 2001 was 83.1%, decreasing 50 basis points from
83.6% for 2000. The improvement in our Commercial medical expense ratio resulted primarily from exercising
pricing discipline in our fully insured accounts.
The Government segment medical expense ratio for 2001 was 83.6%, decreasing 190 basis points from
85.5% for 2000. This improvement primarily resulted from exiting 45 non-core counties in our Medicare+Choice
business with higher medical expense ratios on January 1, 2001, coupled with significant benefit design changes
which also became effective on that date.
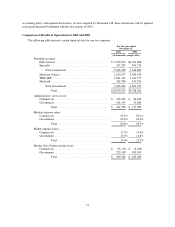
SG&A Expense
Total selling, general and administrative, or SG&A, expenses as a percentage of premium revenues and
administrative services fees, or SG&A expense ratio, for 2001 was 15.3%, increasing 80 basis points from 14.5%
in 2000. Similar increases occurred in the SG&A expense ratios of our Commercial and Government segments as
indicated in the preceding table. These increases resulted from an increase in the mix of ASO membership,
primarily from the TRICARE acquisition, and planned spending on infrastructure and technology initiatives.
Depreciation and amortization was $161.5 million in 2001, an increase of $15.0 million, or 10.2%, from
$146.5 million in 2000. This increase was the result of increased capital expenditures primarily related to our
technology initiatives and the TRICARE acquisition on May 31, 2001.
Interest Expense
Interest expense was $25.3 million in 2001, a decrease of $3.3 million from $28.6 million in 2000. This
decline was attributable to the impact from lower interest rates that were offset by higher average daily
outstanding borrowings. A greater proportion of total debt outstanding during 2001 resulted from borrowings
under our credit agreement, and later in the year under the 5-year senior notes issued in August 2001. These
borrowings have longer maturities than borrowings under our commercial paper program, resulting in higher
daily average outstanding borrowings in 2001 compared to 2000. As a result of this changing debt mix, daily
cash in excess of our funding requirements was invested, causing higher average invested balances described
above.
37