Sony 2001 Annual Report Download - page 107
Download and view the complete annual report
Please find page 107 of the 2001 Sony annual report below. You can navigate through the pages in the report by either clicking on the pages listed below, or by using the keyword search tool below to find specific information within the annual report.-
 1
1 -
2
-
3
-
4
-
5
-
6
-
7
-
8
-
9
-
10
-
11
-
12
-
13
-
14
-
15
-
16
-
17
-
18
-
19
-
20
-
21
-
22
-
23
-
24
-
25
-
26
-
27
-
28
-
29
-
30
-
31
-
32
-
33
-
34
-
35
-
36
-
37
-
38
-
39
-
40
-
41
-
42
-
43
-
44
-
45
-
46
-
47
-
48
-
49
-
50
-
51
-
52
-
53
-
54
-
55
-
56
-
57
-
58
-
59
-
60
-
61
-
62
-
63
-
64
-
65
-
66
-
67
-
68
-
69
-
70
-
71
-
72
-
73
-
74
-
75
-
76
-
77
-
78
-
79
-
80
-
81
-
82
-
83
-
84
-
85
-
86
-
87
-
88
-
89
-
90
-
91
-
92
-
93
-
94
-
95
-
96
-
 97
97 -
 98
98 -
 99
99 -
 100
100 -
 101
101 -
 102
102 -
 103
103 -
 104
104 -
 105
105 -
 106
106 -
 107
107 -
 108
108 -
 109
109 -
 110
110 -
 111
111 -
 112
112 -
 113
113 -
 114
114 -
 115
115 -
 116
116 -
 117
117 -
118
-
119
-
120
-
121
-
122
-
123
-
124
-
125
-
126
-
127
-
128
-
129
-
130
-
131
-
132
-
133
-
134
-
135
-
136
-
137
-
138
-
139
-
140
 |
 |

Sony Corporation Annual Report 2001
105
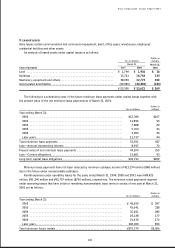
Unaudited
Year ended March 31
1999 2000
Yen in millions
Net sales (No change) . . . . . . . . . . . . . . . . . . . . . . . . . . . . . . . . . . . . . . . . . . . . . . . . . . . ¥6,415,418 ¥6,238,401
Net income . . . . . . . . . . . . . . . . . . . . . . . . . . . . . . . . . . . . . . . . . . . . . . . . . . . . . . . . . . . 174,870 123,183
Yen
Net income per common share:
Basic . . . . . . . . . . . . . . . . . . . . . . . . . . . . . . . . . . . . . . . . . . . . . . . . . . . . . . . . . . . . . . ¥197.49 ¥138.07
Diluted . . . . . . . . . . . . . . . . . . . . . . . . . . . . . . . . . . . . . . . . . . . . . . . . . . . . . . . . . . . . . 178.37 126.50
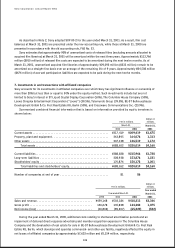
The pro forma results of operations are not necessarily indicative of the actual results of operations that would
have occurred had the exchanges been consummated at the beginning of the respective years, or of results that
may occur in the future. The pro forma net income per common share for the years ended March 31, 1999 and 2000
reflects the two-for-one stock split that has become effective on May 19, 2000.
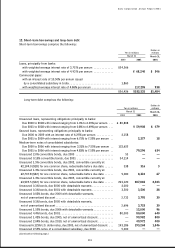
5. Inventories
Inventories comprise the following:
Dollars in
Yen in millions millions
March 31 March 31,
2000 2001 2001
Finished products . . . . . . . . . . . . . . . . . . . . . . . . . . . . . . . . . . . . . . . . . . . . . . . ¥473,935 ¥624,055 $4,992
Work in process . . . . . . . . . . . . . . . . . . . . . . . . . . . . . . . . . . . . . . . . . . . . . . . . 106,749 125,198 1,002
Raw materials, purchased components and supplies . . . . . . . . . . . . . . . . . . . . 165,866 193,623 1,549
¥746,550 ¥942,876 $7,543
6. Film costs
Film costs comprise the following:
Dollars in
Yen in millions millions
March 31 March 31,
2000 2001 2001
Theatrical:
Released (including acquired film libraries) . . . . . . . . . . . . . . . . . . . . . . . . . ¥178,131 ¥169,522 $1,356
In production and development . . . . . . . . . . . . . . . . . . . . . . . . . . . . . . . . . . 106,976 77,876 623
Television licensing:
Released (including acquired film libraries) . . . . . . . . . . . . . . . . . . . . . . . . . 42,634 37,700 302
In production and development . . . . . . . . . . . . . . . . . . . . . . . . . . . . . . . . . . 11,270 12,519 100
¥339,011 ¥297,617 $2,381