Sony 2001 Annual Report Download - page 132
Download and view the complete annual report
Please find page 132 of the 2001 Sony annual report below. You can navigate through the pages in the report by either clicking on the pages listed below, or by using the keyword search tool below to find specific information within the annual report.-
 1
1 -
2
-
3
-
4
-
5
-
6
-
7
-
8
-
9
-
10
-
11
-
12
-
13
-
14
-
15
-
16
-
17
-
18
-
19
-
20
-
21
-
22
-
23
-
24
-
25
-
26
-
27
-
28
-
29
-
30
-
31
-
32
-
33
-
34
-
35
-
36
-
37
-
38
-
39
-
40
-
41
-
42
-
43
-
44
-
45
-
46
-
47
-
48
-
49
-
50
-
51
-
52
-
53
-
54
-
55
-
56
-
57
-
58
-
59
-
60
-
61
-
62
-
63
-
64
-
65
-
66
-
67
-
68
-
69
-
70
-
71
-
72
-
73
-
74
-
75
-
76
-
77
-
78
-
79
-
80
-
81
-
82
-
83
-
84
-
85
-
86
-
87
-
88
-
89
-
90
-
91
-
92
-
93
-
94
-
95
-
96
-
97
-
98
-
99
-
100
-
101
-
102
-
103
-
104
-
105
-
106
-
107
-
108
-
109
-
110
-
111
-
112
-
113
-
114
-
115
-
116
-
117
-
118
-
119
-
120
-
121
-
 122
122 -
 123
123 -
 124
124 -
 125
125 -
 126
126 -
 127
127 -
 128
128 -
 129
129 -
 130
130 -
 131
131 -
 132
132 -
 133
133 -
 134
134 -
 135
135 -
 136
136 -
 137
137 -
 138
138 -
 139
139 -
 140
140
 |
 |

Sony Corporation Annual Report 2001
130
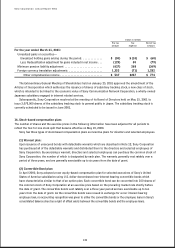
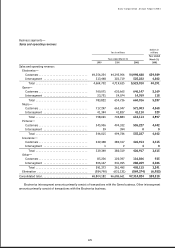
Segment profit or loss:
Dollars in
Yen in millions millions
Year ended
Year ended March 31 March 31,
1999 2000 2001 2001
Operating income (loss):
Electronics . . . . . . . . . . . . . . . . . . . . . . . . . . . . . . . . . . ¥120,951 ¥101,397 ¥248,652 $ 1,989
Game . . . . . . . . . . . . . . . . . . . . . . . . . . . . . . . . . . . . . . 136,418 76,935 (51,118) (409)
Music . . . . . . . . . . . . . . . . . . . . . . . . . . . . . . . . . . . . . . 36,527 28,293 20,502 164
Pictures . . . . . . . . . . . . . . . . . . . . . . . . . . . . . . . . . . . . 38,959 35,920 4,315 35
Insurance . . . . . . . . . . . . . . . . . . . . . . . . . . . . . . . . . . 18,013 20,855 17,892 143
Other . . . . . . . . . . . . . . . . . . . . . . . . . . . . . . . . . . . . . . (352) (9,860) (11,276) (90)
Total . . . . . . . . . . . . . . . . . . . . . . . . . . . . . . . . . . 350,516 253,540 228,967 1,832
Elimination . . . . . . . . . . . . . . . . . . . . . . . . . . . . . . . . . 10,282 10,362 13,376 107
Unallocated amounts:
Corporate expenses . . . . . . . . . . . . . . . . . . . . . . . . . (22,737) (40,698) (16,997) (136)
Consolidated operating income . . . . . . . . . . . . . . . . . . . 338,061 223,204 225,346 1,803
Other income . . . . . . . . . . . . . . . . . . . . . . . . . . . . . . . . . 149,697 146,299 167,654 1,341
Other expenses . . . . . . . . . . . . . . . . . . . . . . . . . . . . . . . . (110,067) (105,193) (127,132) (1,017)
Consolidated income before income taxes . . . . . . . . . . . ¥377,691 ¥264,310 ¥265,868 $ 2,127
Operating income is sales and operating revenue less costs and operating expenses. The decrease in
unallocated corporate expenses in the year ended March 31, 2001 was primarily due to a decrease in stock-based
compensation expenses (Note 16).
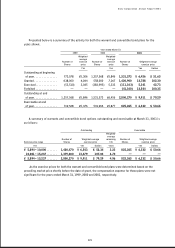
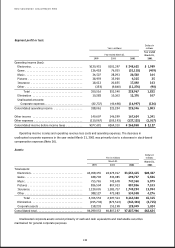
Assets:
Dollars in
Yen in millions millions
March 31 March 31,
1999 2000 2001 2001
Total assets:
Electronics . . . . . . . . . . . . . . . . . . . . . . . . . . . . . . . . . . ¥3,058,355 ¥3,074,917 ¥3,554,615 $28,437
Game . . . . . . . . . . . . . . . . . . . . . . . . . . . . . . . . . . . . . . 188,796 446,085 690,737 5,526
Music . . . . . . . . . . . . . . . . . . . . . . . . . . . . . . . . . . . . . . 755,765 742,678 747,360 5,979
Pictures . . . . . . . . . . . . . . . . . . . . . . . . . . . . . . . . . . . . 836,504 807,033 887,806 7,103
Insurance . . . . . . . . . . . . . . . . . . . . . . . . . . . . . . . . . . 1,129,005 1,383,717 1,749,294 13,994
Other . . . . . . . . . . . . . . . . . . . . . . . . . . . . . . . . . . . . . . 388,127 473,083 534,508 4,276
Total . . . . . . . . . . . . . . . . . . . . . . . . . . . . . . . . . . 6,356,552 6,927,513 8,164,320 65,315
Elimination . . . . . . . . . . . . . . . . . . . . . . . . . . . . . . . . . (215,732) (273,514) (464,403) (3,715)
Corporate assets . . . . . . . . . . . . . . . . . . . . . . . . . . . . . 158,233 153,198 128,049 1,024
Consolidated total . . . . . . . . . . . . . . . . . . . . . . . . . . . . . . ¥6,299,053 ¥6,807,197 ¥7,827,966 $62,624
Unallocated corporate assets consist primarily of cash and cash equivalents and marketable securities
maintained for general corporate purposes.