Sony 2001 Annual Report Download - page 110
Download and view the complete annual report
Please find page 110 of the 2001 Sony annual report below. You can navigate through the pages in the report by either clicking on the pages listed below, or by using the keyword search tool below to find specific information within the annual report.-
 1
1 -
2
-
3
-
4
-
5
-
6
-
7
-
8
-
9
-
10
-
11
-
12
-
13
-
14
-
15
-
16
-
17
-
18
-
19
-
20
-
21
-
22
-
23
-
24
-
25
-
26
-
27
-
28
-
29
-
30
-
31
-
32
-
33
-
34
-
35
-
36
-
37
-
38
-
39
-
40
-
41
-
42
-
43
-
44
-
45
-
46
-
47
-
48
-
49
-
50
-
51
-
52
-
53
-
54
-
55
-
56
-
57
-
58
-
59
-
60
-
61
-
62
-
63
-
64
-
65
-
66
-
67
-
68
-
69
-
70
-
71
-
72
-
73
-
74
-
75
-
76
-
77
-
78
-
79
-
80
-
81
-
82
-
83
-
84
-
85
-
86
-
87
-
88
-
89
-
90
-
91
-
92
-
93
-
94
-
95
-
96
-
97
-
98
-
99
-
 100
100 -
 101
101 -
 102
102 -
 103
103 -
 104
104 -
 105
105 -
 106
106 -
 107
107 -
 108
108 -
 109
109 -
 110
110 -
 111
111 -
 112
112 -
 113
113 -
 114
114 -
 115
115 -
 116
116 -
 117
117 -
 118
118 -
 119
119 -
 120
120 -
121
-
122
-
123
-
124
-
125
-
126
-
127
-
128
-
129
-
130
-
131
-
132
-
133
-
134
-
135
-
136
-
137
-
138
-
139
-
140
 |
 |

Sony Corporation Annual Report 2001
108
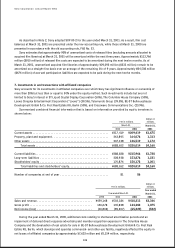
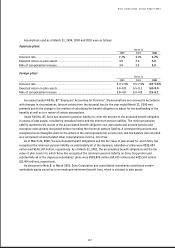
Dollars in millions
March 31, 2001
Gross Gross
unrealized unrealized
Cost gains losses Fair value
Available-for-sale:
Debt securities . . . . . . . . . . . . . . . . . . . . . . . . . . . . . . . . . . . . . . . . . $7,069 $426 $19 $7,476
Equity securities . . . . . . . . . . . . . . . . . . . . . . . . . . . . . . . . . . . . . . . . 367 260 65 562
Held-to-maturity
securities . . . . . . . . . . . . . . . . . . . . . . . . . . . . . . . . . . . . . . . . . . . . . . . 131 1 —132
Total . . . . . . . . . . . . . . . . . . . . . . . . . . . . . . . . . . . . . . . . . . . . . . . $7,567 $687 $84 $8,170
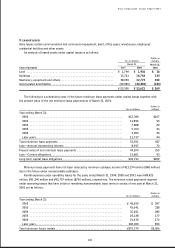
At March 31, 2001, debt securities classified as available-for-sale securities and held-to-maturity securities
mainly consist of Japanese government and municipal bonds and corporate debt securities due within 1 to 17 years.
Proceeds from sales of available-for-sale securities were ¥571,330 million, ¥186,093 million and ¥91,424 million
($731 million) for the years ended March 31, 1999, 2000 and 2001, respectively. On those sales, gross realized
gains computed on the average cost basis were ¥6,705 million, ¥18,887 million and ¥5,291 million ($42 million)
and gross realized losses were ¥1,851 million, ¥2,394 million and ¥416 million ($3 million), respectively.
In March 2001, Sony Corporation and consolidated subsidiaries contributed certain marketable equity securities,
not including those of its subsidiaries and affiliated companies, to an employee retirement benefit trust, with no cash
proceeds thereon. The fair value of these securities at the time of contribution was ¥14,316 million ($115 million).
In the fourth quarter of the year ended March 31, 2001, due to a change in the partial investment policy of a life
insurance subsidiary, certain amounts previously included in marketable securities as short-term investments in
money market funds have been transferred to available-for-sale securities and included in securities investments
and other on the balance sheet as of March 31, 2001. At March 31, 2000, marketable securities on the balance
sheet included ¥34,525 million of short-term investments in money market funds relevant to the change.
Marketable securities as of March 31, 2000 and 2001 included short-term investments in money market funds
of ¥85,928 million and ¥72,152 million ($577 million), respectively.
In the ordinary course of business, Sony maintains long-term investment securities, included in securities
investments and other, issued by a number of nonpublic companies. The aggregate carrying amounts of the invest-
ments in nonpublic companies at March 31, 2000 and 2001, which were valued at cost, were ¥38,826 million and
¥92,565 million ($741 million), respectively. The corresponding fair values of the investments in nonpublic
companies were not computed as such estimation was not readily determinable. If the value of an investment has
declined and is judged to be other than temporary, the investment is written down to its fair value.
The net change in the unrealized gains or losses on trading securities that has been included in earnings during
the years ended March 31, 1999, 2000 and 2001 was insignificant.
Securities investments and other as of March 31, 2000 and 2001 also included separate account’s assets (Note
11) in the life insurance business, which were carried at fair value. Although the separate account’s assets consist
primarily of debt and equity securities, they are excluded from the above table due to a nature of the assets.
Proceeds from sales of available-for-sale securities and gross realized gains or losses described above also exclude
the amounts related to the separate account’s assets. Separate account’s assets at March 31, 2000 and 2001 were
¥71,888 million and ¥91,956 million ($736 million), respectively.