Sony 2001 Annual Report Download - page 77
Download and view the complete annual report
Please find page 77 of the 2001 Sony annual report below. You can navigate through the pages in the report by either clicking on the pages listed below, or by using the keyword search tool below to find specific information within the annual report.-
 1
1 -
2
-
3
-
4
-
5
-
6
-
7
-
8
-
9
-
10
-
11
-
12
-
13
-
14
-
15
-
16
-
17
-
18
-
19
-
20
-
21
-
22
-
23
-
24
-
25
-
26
-
27
-
28
-
29
-
30
-
31
-
32
-
33
-
34
-
35
-
36
-
37
-
38
-
39
-
40
-
41
-
42
-
43
-
44
-
45
-
46
-
47
-
48
-
49
-
50
-
51
-
52
-
53
-
54
-
55
-
56
-
57
-
58
-
59
-
60
-
61
-
62
-
63
-
64
-
65
-
66
-
 67
67 -
 68
68 -
 69
69 -
 70
70 -
 71
71 -
 72
72 -
 73
73 -
 74
74 -
 75
75 -
 76
76 -
 77
77 -
 78
78 -
 79
79 -
 80
80 -
 81
81 -
 82
82 -
 83
83 -
 84
84 -
 85
85 -
 86
86 -
 87
87 -
88
-
89
-
90
-
91
-
92
-
93
-
94
-
95
-
96
-
97
-
98
-
99
-
100
-
101
-
102
-
103
-
104
-
105
-
106
-
107
-
108
-
109
-
110
-
111
-
112
-
113
-
114
-
115
-
116
-
117
-
118
-
119
-
120
-
121
-
122
-
123
-
124
-
125
-
126
-
127
-
128
-
129
-
130
-
131
-
132
-
133
-
134
-
135
-
136
-
137
-
138
-
139
-
140
 |
 |
Sony Corporation Annual Report 2001
75
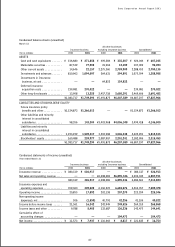
business, inventories increased by 103.4 billion yen, or 15.2%, to 782.0 billion yen. Regarding the trend of
inventories in the Electronics business since March 31, 2000, those at December 31, 2000 had increased 225.1
billion yen, or 33.2%, to 903.7 billion yen, compared with those at March 31, 2000. This was primarily because
Sony increased manufacturing output especially in the first half of the fiscal year, reflecting higher demand in
product categories such as digital equipment and electronic devices, and this was followed by a slowdown in
the rate of sales growth in the U.S. becoming clear from December 2000 to the end of the year. However, due
to Sony’s efforts to reduce inventories by reducing manufacturing output and further promoting sales during
the fourth quarter, inventories at March 31, 2001 were reduced to the level of 782.0 billion yen, despite the
yen’s depreciation during the fourth quarter. In the Game business, inventories increased 80.7 billion yen, or
335.3%, to 104.7 billion yen primarily at manufacturing facilities in Japan, as Sony continued to increase
manufacturing output for PlayStation 2 hardware. Due to the aforementioned inventory controls, implemented in
response to rapid changes in demand trends, particularly in the Electronics business, the inventory to cost of
sales turn-over ratio (based on the average of inventories at the end of each fiscal year and previous fiscal year)
was 2.01 months, which was almost the same level as that in the previous year. Please note that inventories at
previous fiscal years-end have been reclassified due to the adoption of the new film accounting standard (refer
to Note 2 of Notes to Consolidated Financial Statements).
Investments and advances increased by 313.4 billion yen, or 29.1%, to 1,389.0 billion yen. The increase was
due to the increases in securities investment and other, while investments and advances to affiliated companies
decreased. The increase in securities investment and other was primarily due to higher investment assets in the
Insurance business, reflecting net increases in life insurance-in-force. Also attributable was the fact that invest-
ment in other companies was larger than the sale of securities investments and subsidiaries. Investments and
advances to affiliated companies decreased primarily due to the impairment write-off against the entire carrying
value of Sony’s investment in Loews.
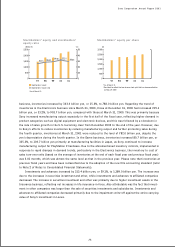
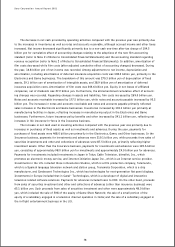
Stockholders’ equity ratio
* As of March 31
Stockholders’ equity
(Billion ¥) (%)
Stockholders’ equity and stockholders’
equity ratio
0
500
1,000
1,500
2,000
2,500
0
10
20
30
40
50
97 98 99 00 01
29.6%
32.1%
29.0%
28.4%
25.7%
* As of March 31
* Restated to reflect the two-for-one stock split that has become effective
on May 19, 2000
(¥)
Stockholders’ equity per share
0
500
1,000
1,500
2,000
2,500
3,000
97 98 99 00 01