Sony 2001 Annual Report Download - page 128
Download and view the complete annual report
Please find page 128 of the 2001 Sony annual report below. You can navigate through the pages in the report by either clicking on the pages listed below, or by using the keyword search tool below to find specific information within the annual report.-
 1
1 -
2
-
3
-
4
-
5
-
6
-
7
-
8
-
9
-
10
-
11
-
12
-
13
-
14
-
15
-
16
-
17
-
18
-
19
-
20
-
21
-
22
-
23
-
24
-
25
-
26
-
27
-
28
-
29
-
30
-
31
-
32
-
33
-
34
-
35
-
36
-
37
-
38
-
39
-
40
-
41
-
42
-
43
-
44
-
45
-
46
-
47
-
48
-
49
-
50
-
51
-
52
-
53
-
54
-
55
-
56
-
57
-
58
-
59
-
60
-
61
-
62
-
63
-
64
-
65
-
66
-
67
-
68
-
69
-
70
-
71
-
72
-
73
-
74
-
75
-
76
-
77
-
78
-
79
-
80
-
81
-
82
-
83
-
84
-
85
-
86
-
87
-
88
-
89
-
90
-
91
-
92
-
93
-
94
-
95
-
96
-
97
-
98
-
99
-
100
-
101
-
102
-
103
-
104
-
105
-
106
-
107
-
108
-
109
-
110
-
111
-
112
-
113
-
114
-
115
-
116
-
117
-
 118
118 -
 119
119 -
 120
120 -
 121
121 -
 122
122 -
 123
123 -
 124
124 -
 125
125 -
 126
126 -
 127
127 -
 128
128 -
 129
129 -
 130
130 -
 131
131 -
 132
132 -
 133
133 -
 134
134 -
 135
135 -
 136
136 -
 137
137 -
 138
138 -
139
-
140
 |
 |

Sony Corporation Annual Report 2001
126
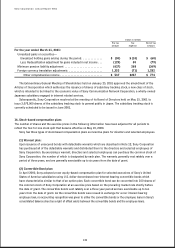
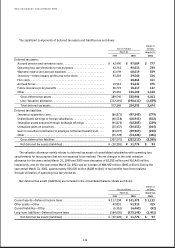
The significant components of deferred tax assets and liabilities are as follows:
Dollars in
Yen in millions millions
March 31 March 31,
2000 2001 2001
Deferred tax assets:
Accrued pension and severance costs . . . . . . . . . . . . . . . . . . . . . . . . . . . ¥ 63,490 ¥97,084 $ 777
Operating loss carryforwards for tax purposes . . . . . . . . . . . . . . . . . . . . 63,761 90,014 720
Warranty reserve and accrued expenses . . . . . . . . . . . . . . . . . . . . . . . . . 61,049 68,619 549
Inventory—intercompany profits and write-down . . . . . . . . . . . . . . . . . 45,293 39,560 316
Film costs . . . . . . . . . . . . . . . . . . . . . . . . . . . . . . . . . . . . . . . . . . . . . . . . — 38,866 311
Accrued bonus . . . . . . . . . . . . . . . . . . . . . . . . . . . . . . . . . . . . . . . . . . . . . 19,912 34,341 275
Future insurance policy benefits . . . . . . . . . . . . . . . . . . . . . . . . . . . . . . . 40,774 18,317 147
Other . . . . . . . . . . . . . . . . . . . . . . . . . . . . . . . . . . . . . . . . . . . . . . . . . . . . 95,261 146,105 1,168
Gross deferred tax assets . . . . . . . . . . . . . . . . . . . . . . . . . . . . . . . . . . 389,540 532,906 4,263
Less: Valuation allowance . . . . . . . . . . . . . . . . . . . . . . . . . . . . . . . . . . (112,191) (198,613) (1,589)
Total deferred tax assets . . . . . . . . . . . . . . . . . . . . . . . . . . . . . . . . . . . 277,349 334,293 2,674
Deferred tax liabilities:
Insurance acquisition costs . . . . . . . . . . . . . . . . . . . . . . . . . . . . . . . . . . . (86,873) (97,345) (779)
Undistributed earnings of foreign subsidiaries . . . . . . . . . . . . . . . . . . . . (60,518) (68,941) (552)
Intangible assets acquired through exchange offerings . . . . . . . . . . . . . (45,872) (42,385) (339)
Unrealized gains on securities . . . . . . . . . . . . . . . . . . . . . . . . . . . . . . . . . (35,437) (30,451) (244)
Gain on securities contribution to employee retirement benefit trust . . . . (23,097) (29,967) (240)
Other . . . . . . . . . . . . . . . . . . . . . . . . . . . . . . . . . . . . . . . . . . . . . . . . . . . . (55,778) (53,428) (426)
Gross deferred tax liabilities . . . . . . . . . . . . . . . . . . . . . . . . . . . . . . . . (307,575) (322,517) (2,580)
Net deferred tax assets (liabilities) . . . . . . . . . . . . . . . . . . . . . . . . . . . ¥ (30,226) ¥11,776 $ 94
The valuation allowance mainly relates to deferred tax assets of consolidated subsidiaries with operating loss
carryforwards for tax purposes that are not expected to be realized. The net changes in the total valuation
allowance for the years ended March 31, 1999 and 2000 were decreases of ¥3,252 million and ¥10,465 million,
respectively, and for the year ended March 31, 2001 was an increase of ¥86,422 million ($691 million). During the
year ended March 31, 2001, approximately ¥16,000 million ($128 million) of tax benefits have been realized
through utilization of operating loss carryforwards.
Net deferred tax assets (liabilities) are included in the consolidated balance sheets as follows:
Dollars in
Yen in millions millions
March 31 March 31,
2000 2001 2001
Current assets—Deferred income taxes . . . . . . . . . . . . . . . . . . . . . . . . . . . ¥ 117,258 ¥141,473 $ 1,132
Other assets—Other . . . . . . . . . . . . . . . . . . . . . . . . . . . . . . . . . . . . . . . . . . 42,852 51,914 415
Current liabilities—Other . . . . . . . . . . . . . . . . . . . . . . . . . . . . . . . . . . . . . . (6,316) (6,463) (52)
Long-term liabilities—Deferred income taxes . . . . . . . . . . . . . . . . . . . . . . (184,020) (175,148) (1,401)
Net deferred tax assets (liabilities) . . . . . . . . . . . . . . . . . . . . . . . . . . . ¥ (30,226) ¥11,776 $ 94