Sony 2001 Annual Report Download - page 66
Download and view the complete annual report
Please find page 66 of the 2001 Sony annual report below. You can navigate through the pages in the report by either clicking on the pages listed below, or by using the keyword search tool below to find specific information within the annual report.-
 1
1 -
2
-
3
-
4
-
5
-
6
-
7
-
8
-
9
-
10
-
11
-
12
-
13
-
14
-
15
-
16
-
17
-
18
-
19
-
20
-
21
-
22
-
23
-
24
-
25
-
26
-
27
-
28
-
29
-
30
-
31
-
32
-
33
-
34
-
35
-
36
-
37
-
38
-
39
-
40
-
41
-
42
-
43
-
44
-
45
-
46
-
47
-
48
-
49
-
50
-
51
-
52
-
53
-
54
-
55
-
 56
56 -
 57
57 -
 58
58 -
 59
59 -
 60
60 -
 61
61 -
 62
62 -
 63
63 -
 64
64 -
 65
65 -
 66
66 -
 67
67 -
 68
68 -
 69
69 -
 70
70 -
 71
71 -
 72
72 -
 73
73 -
 74
74 -
 75
75 -
 76
76 -
77
-
78
-
79
-
80
-
81
-
82
-
83
-
84
-
85
-
86
-
87
-
88
-
89
-
90
-
91
-
92
-
93
-
94
-
95
-
96
-
97
-
98
-
99
-
100
-
101
-
102
-
103
-
104
-
105
-
106
-
107
-
108
-
109
-
110
-
111
-
112
-
113
-
114
-
115
-
116
-
117
-
118
-
119
-
120
-
121
-
122
-
123
-
124
-
125
-
126
-
127
-
128
-
129
-
130
-
131
-
132
-
133
-
134
-
135
-
136
-
137
-
138
-
139
-
140
 |
 |

Sony Corporation Annual Report 2001
64
reflecting the introductions of PS one in September 2000 and PlayStation 2 in October 2000 although software
sales decreased. The strength of the yen against the U.S. dollar had a negative effect on sales. In Europe, although
hardware sales increased reflecting the introduction of PS one in September 2000 and PlayStation 2 in November
2000, overall sales decreased in Europe due to lower sales of software. The significant strength of the yen against
the euro had a significant negative effect on sales. In addition, in the U.S. and Europe, due to shortages in produc-
tion shipments and supplies of PlayStation and PS one hardware in certain periods during the year, sales of such
hardware decreased in the corresponding periods, and software sales in those areas were negatively affected.
Total worldwide production shipments of PlayStation and PS one hardware for the fiscal year ended March
31, 2001 were 9.31 million units for the year compared with 18.50 million units for the previous year, resulting in
cumulative production shipments of 82.23 million units as of March 31, 2001. Worldwide production shipments of
PlayStation 2 hardware were 9.20 million units for the year compared with 1.41 million units for the previous
year, resulting in cumulative production shipments of 10.61 million units as of March 31, 2001. Worldwide
production shipments of PlayStation software (including that from both Sony and third parties under Sony
licenses) were 135 million units for the year compared with 200 million units for the previous year, resulting in
cumulative production shipments of 765 million units as of March 31, 2001. In addition, worldwide production
shipments of PlayStation 2 software (including that from both Sony and third parties under Sony licenses) were
35.4 million units for the year compared with 2.9 million units for the previous year, resulting in cumulative
production shipments of 38.3 million units as of March 31, 2001.
Operating losses were recorded during the year principally due to the aforementioned software sales decrease
and start-up expenses for the PlayStation 2 format. Cost of sales in the Game business increased principally due
to manufacturing-related expenses for PlayStation 2 hardware, including raw materials and depreciation, which
are attributable to capital expenditures from previous years. Selling, general, and administrative expenses also
increased principally due to amortization of intangible assets and goodwill resulting from the acquisition trans-
actions of three listed subsidiaries (refer to Note 4 of Notes to Consolidated Financial Statements). As a result,
the ratio of cost of sales and the ratio of selling, general, and administrative expenses to sales rose.
Sales in the Game business were negatively impacted by the yen’s strength against the U.S. dollar and
particularly the euro. On a local currency basis, sales for the fiscal year ended March 31, 2001 increased approxi-
mately 2% and an operating loss was recorded compared with an operating profit in the previous year.
MUSIC
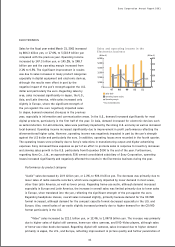
Sales for the fiscal year ended March 31, 2001
decreased by 94.8 billion yen, or 13.4%, to 612.1
billion yen compared with the previous year. Operat-
ing income decreased by 7.8 billion yen, or 27.5%, to
20.5 billion yen and the operating margin decreased
from 4.0% to 3.3%.
Regarding the results of Sony Music Entertainment
Inc. (“SMEI”), the U.S. based operation, sales and
operating income decreased. The lower sales were
primarily due to soft market conditions in a number
of international territories, the delayed timing of
certain new releases, and the strengthening of the U.S.
dollar against foreign currencies, despite the strong
sales of several albums. Regarding profit perfor-
mance, the decrease in profit was primarily due to
(Billion ¥)
Sales (left)
Operating margin
* Year ended March 31
Operating income (right)
(Billion ¥)
Sales and operating income in the
Music business
0
50
100
150
200
97 98 99 00 01
0
200
400
600
800
3.3%
4.0%
4.8%
7.5%
6.7%