Sony 2001 Annual Report Download - page 79
Download and view the complete annual report
Please find page 79 of the 2001 Sony annual report below. You can navigate through the pages in the report by either clicking on the pages listed below, or by using the keyword search tool below to find specific information within the annual report.-
 1
1 -
2
-
3
-
4
-
5
-
6
-
7
-
8
-
9
-
10
-
11
-
12
-
13
-
14
-
15
-
16
-
17
-
18
-
19
-
20
-
21
-
22
-
23
-
24
-
25
-
26
-
27
-
28
-
29
-
30
-
31
-
32
-
33
-
34
-
35
-
36
-
37
-
38
-
39
-
40
-
41
-
42
-
43
-
44
-
45
-
46
-
47
-
48
-
49
-
50
-
51
-
52
-
53
-
54
-
55
-
56
-
57
-
58
-
59
-
60
-
61
-
62
-
63
-
64
-
65
-
66
-
67
-
68
-
 69
69 -
 70
70 -
 71
71 -
 72
72 -
 73
73 -
 74
74 -
 75
75 -
 76
76 -
 77
77 -
 78
78 -
 79
79 -
 80
80 -
 81
81 -
 82
82 -
 83
83 -
 84
84 -
 85
85 -
 86
86 -
 87
87 -
 88
88 -
 89
89 -
90
-
91
-
92
-
93
-
94
-
95
-
96
-
97
-
98
-
99
-
100
-
101
-
102
-
103
-
104
-
105
-
106
-
107
-
108
-
109
-
110
-
111
-
112
-
113
-
114
-
115
-
116
-
117
-
118
-
119
-
120
-
121
-
122
-
123
-
124
-
125
-
126
-
127
-
128
-
129
-
130
-
131
-
132
-
133
-
134
-
135
-
136
-
137
-
138
-
139
-
140
 |
 |
Sony Corporation Annual Report 2001
77
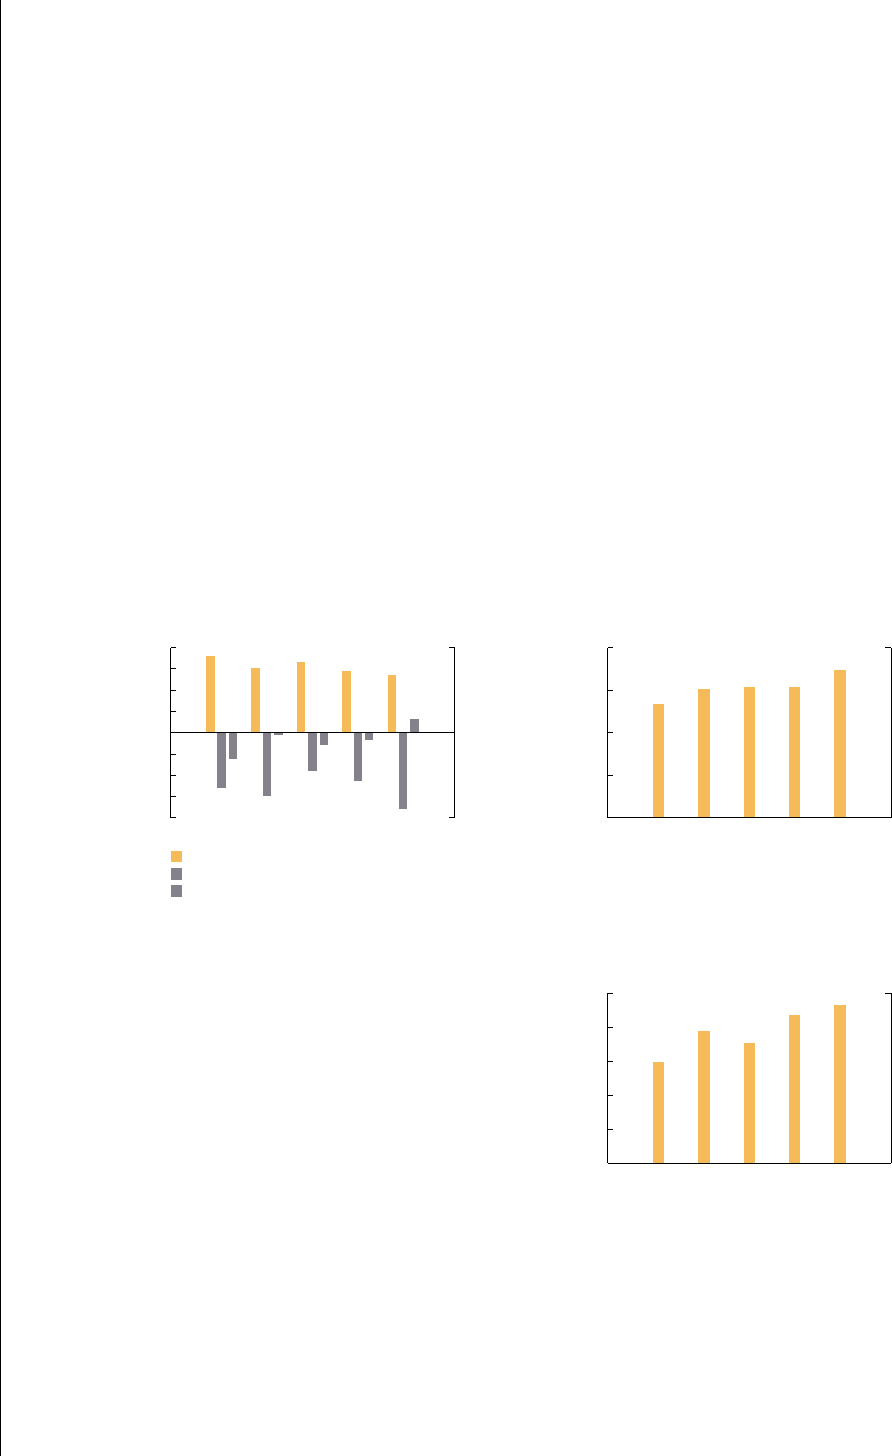
Cash Flows
(The fiscal year ended March 31, 2001 compared with the fiscal year ended March 31, 2000)
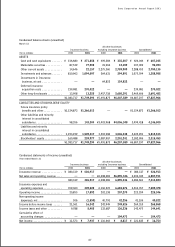
During the fiscal year ended March 31, 2001, Sony generated 544.8 billion yen (a decrease of 34.7 billion yen, or
6.0%, compared with the previous year) of net cash from operating activities. Sony used 719.0 billion yen (an
increase of 269.2 billion yen, or 59.8%, compared with the previous year) of net cash in investing activities. Sony
generated 134.4 billion yen of net cash in financing activities as opposed to using 68.1 billion yen in the previous
year. As a result, during the fiscal year ended March 31, 2001, cash and cash equivalents at end of year de-
creased by 18.8 billion yen, or 3.0%, to 607.2 billion yen compared with the previous year, despite the positive
effect of exchange rate changes on cash and cash equivalents of 21.0 billion yen. In the previous year, there was
a negative impact of exchange rate changes on cash and cash equivalents of 27.6 billion yen.
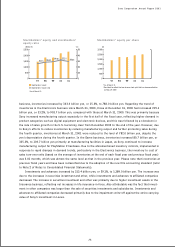
Cash flows from operating activities
(Billion ¥)
Cash flows from financing activities
* Year ended March 31
Cash flows from investing activities
Cash flows
0
200
400
600
800
-800
-600
-400
-200
0
97 98 99 00 01
* Year ended March 31
* Including amortization expenses for intangible assets and for
deffered insurance acquisition costs
(Billion ¥)
Depreciation and amortization
0
100
200
300
400
97 98 99 00 01
* Year ended March 31
(Billion ¥)
Capital expenditures
(additions to fixed assets on the balance sheets)
0
100
200
300
400
500
97 98 99 00 01