Sony 2001 Annual Report Download - page 91
Download and view the complete annual report
Please find page 91 of the 2001 Sony annual report below. You can navigate through the pages in the report by either clicking on the pages listed below, or by using the keyword search tool below to find specific information within the annual report.-
 1
1 -
2
-
3
-
4
-
5
-
6
-
7
-
8
-
9
-
10
-
11
-
12
-
13
-
14
-
15
-
16
-
17
-
18
-
19
-
20
-
21
-
22
-
23
-
24
-
25
-
26
-
27
-
28
-
29
-
30
-
31
-
32
-
33
-
34
-
35
-
36
-
37
-
38
-
39
-
40
-
41
-
42
-
43
-
44
-
45
-
46
-
47
-
48
-
49
-
50
-
51
-
52
-
53
-
54
-
55
-
56
-
57
-
58
-
59
-
60
-
61
-
62
-
63
-
64
-
65
-
66
-
67
-
68
-
69
-
70
-
71
-
72
-
73
-
74
-
75
-
76
-
77
-
78
-
79
-
80
-
 81
81 -
 82
82 -
 83
83 -
 84
84 -
 85
85 -
 86
86 -
 87
87 -
 88
88 -
 89
89 -
 90
90 -
 91
91 -
 92
92 -
 93
93 -
 94
94 -
 95
95 -
 96
96 -
 97
97 -
 98
98 -
 99
99 -
 100
100 -
 101
101 -
102
-
103
-
104
-
105
-
106
-
107
-
108
-
109
-
110
-
111
-
112
-
113
-
114
-
115
-
116
-
117
-
118
-
119
-
120
-
121
-
122
-
123
-
124
-
125
-
126
-
127
-
128
-
129
-
130
-
131
-
132
-
133
-
134
-
135
-
136
-
137
-
138
-
139
-
140
 |
 |

Sony Corporation Annual Report 2001
89
Dollars in
Yen in millions millions**
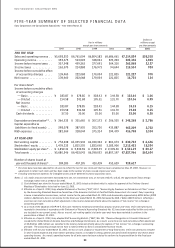
1997 1998 1999 2000 2001 2001
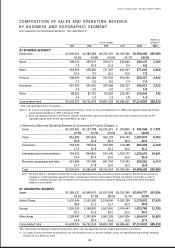
BY BUSINESS SEGMENT*
Electronics . . . . . . . . . . . . . . . . . . . . ¥3,930,614 ¥4,380,084 ¥4,356,254 ¥4,395,906 ¥4,998,688 $39,989
69.5% 64.8% 64.0% 65.7% 68.4%
Game . . . . . . . . . . . . . . . . . . . . . . . . 408,335 699,574 760,071 630,662 646,147 5,169
7.2 10.4 11.2 9.4 8.8
Music . . . . . . . . . . . . . . . . . . . . . . . . 564,364 658,381 717,297 665,047 571,003 4,568
10.0 9.7 10.5 10.0 7.8
Pictures . . . . . . . . . . . . . . . . . . . . . . 438,399 644,183 545,956 494,332 555,227 4,442
7.7 9.5 8.0 7.4 7.6
Insurance . . . . . . . . . . . . . . . . . . . . 227,920 291,061 339,368 380,317 426,913 3,415
4.0 4.3 5.0 5.7 5.8
Other . . . . . . . . . . . . . . . . . . . . . . . . 88,621 87,721 85,236 120,397 116,846 935
1.6 1.3 1.3 1.8 1.6
Consolidated total . . . . . . . . . . . . . . ¥5,658,253 ¥6,761,004 ¥6,804,182 ¥6,686,661 ¥7,314,824 $58,518
* Sales and operating revenue to customers
Notes: 1. As a result of a change in the accounting period in Pictures, results for the year ended March 31, 1998 in the segment include the thirteen-
month period from March 1, 1997 to March 31, 1998.
2. Sales and operating revenue of the Pictures segment and the Other segment for the prior years have been restated to conform to the
reportable segmentation for the year ended March 31, 2001.
« Electronics Sales and Operating Revenue to Customers by Product Category »
Audio . . . . . . . . . . . . . . . . . . . . . . ¥1,029,961 ¥1,127,788 ¥1,072,621 ¥ 934,865 ¥923,968 $ 7,391
26.2% 25.7% 24.6% 21.3% 18.5%
Video . . . . . . . . . . . . . . . . . . . . . . 816,582 870,854 969,129 976,705 1,097,847 8,783
20.8 19.9 22.3 22.2 22.0
Televisions . . . . . . . . . . . . . . . . . . 704,075 709,043 702,620 714,188 805,028 6,440
17.9 16.2 16.1 16.2 16.1
Information and communications . . 764,512 894,810 914,140 1,052,707 1,332,619 10,661
19.4 20.4 21.0 24.0 26.6
Electronic components and other . . 615,484 777,589 697,744 717,441 839,226 6,714
15.7 17.8 16.0 16.3 16.8
Total . . . . . . . . . . . . . . . . . . . . . . . ¥3,930,614 ¥4,380,084 ¥4,356,254 ¥4,395,906 ¥4,998,688 $39,989
Note: The above table is a breakdown of Electronics sales and operating revenue to customers by product category. The Electronics business is
managed as a single operating segment by Sony’s management. However, Sony believes that the information in this table is useful to
investors in understanding the sales contributions of the products in this business segment. Operating income information by product
category is not available.
BY GEOGRAPHIC SEGMENT
Japan . . . . . . . . . . . . . . . . . . . . . . . . ¥1,589,521 ¥1,848,023 ¥1,917,028 ¥2,121,249 ¥2,400,777 $19,206
28.1% 27.3% 28.2% 31.7% 32.8%
United States . . . . . . . . . . . . . . . . . . 1,635,044 2,101,222 2,158,006 2,027,129 2,179,833 17,439
28.9 31.1 31.7 30.3 29.8
Europe . . . . . . . . . . . . . . . . . . . . . . . 1,305,195 1,568,830 1,667,010 1,470,447 1,473,780 11,790
23.1 23.2 24.5 22.0 20.2
Other Areas . . . . . . . . . . . . . . . . . . . 1,128,493 1,242,929 1,062,138 1,067,836 1,260,434 10,083
19.9 18.4 15.6 16.0 17.2
Consolidated total . . . . . . . . . . . . . . ¥5,658,253 ¥6,761,004 ¥6,804,182 ¥6,686,661 ¥7,314,824 $58,518
Note: Classification of Geographic Segment Information shows sales and operating revenue recognized by location of customers.
**
U.S. dollar amounts have been translated from yen, for convenience only, at the rate of ¥125=U.S.$1, the approximate Tokyo foreign exchange
market rate as of March 30, 2001.
COMPOSITION OF SALES AND OPERATING REVENUE
BY BUSINESS AND GEOGRAPHIC SEGMENT
Sony Corporation and Consolidated Subsidiaries •Year ended March 31