Sony 2001 Annual Report Download - page 67
Download and view the complete annual report
Please find page 67 of the 2001 Sony annual report below. You can navigate through the pages in the report by either clicking on the pages listed below, or by using the keyword search tool below to find specific information within the annual report.-
 1
1 -
2
-
3
-
4
-
5
-
6
-
7
-
8
-
9
-
10
-
11
-
12
-
13
-
14
-
15
-
16
-
17
-
18
-
19
-
20
-
21
-
22
-
23
-
24
-
25
-
26
-
27
-
28
-
29
-
30
-
31
-
32
-
33
-
34
-
35
-
36
-
37
-
38
-
39
-
40
-
41
-
42
-
43
-
44
-
45
-
46
-
47
-
48
-
49
-
50
-
51
-
52
-
53
-
54
-
55
-
56
-
 57
57 -
 58
58 -
 59
59 -
 60
60 -
 61
61 -
 62
62 -
 63
63 -
 64
64 -
 65
65 -
 66
66 -
 67
67 -
 68
68 -
 69
69 -
 70
70 -
 71
71 -
 72
72 -
 73
73 -
 74
74 -
 75
75 -
 76
76 -
 77
77 -
78
-
79
-
80
-
81
-
82
-
83
-
84
-
85
-
86
-
87
-
88
-
89
-
90
-
91
-
92
-
93
-
94
-
95
-
96
-
97
-
98
-
99
-
100
-
101
-
102
-
103
-
104
-
105
-
106
-
107
-
108
-
109
-
110
-
111
-
112
-
113
-
114
-
115
-
116
-
117
-
118
-
119
-
120
-
121
-
122
-
123
-
124
-
125
-
126
-
127
-
128
-
129
-
130
-
131
-
132
-
133
-
134
-
135
-
136
-
137
-
138
-
139
-
140
 |
 |

Sony Corporation Annual Report 2001
65
the aforementioned factors which resulted in lower sales, as well as increased spending associated with various
digital media development and investing activities and expenses associated with the discontinuation and closure
in March 2001 of a U.S. manufacturing facility where cassette music software was previously manufactured.
Despite the lower sales, the ratio of selling, general, and administrative expenses to sales during the year was
almost flat compared with the previous year due to the benefit of global cost reduction initiatives. During the
year, SMEI reduced its worldwide work force by 10%.
Regarding the results of the Music business in Japan, comprised of Sony Music Entertainment (Japan) Inc.
(“SMEJ”) and its subsidiaries, overall sales decreased primarily due to lower sales of SMEJ reflecting the delay
of releases from certain artists and due to discontinuation of a business to sell CD-ROM software at an SMEJ
subsidiary. Despite the decrease in sales, operating income increased by pursuing efficiencies in such areas as
advertising expenses at SMEJ.
Regarding results in the Music business on a local currency basis, sales for the fiscal year ended March 31,
2001 decreased approximately 14% and operating income decreased approximately 38% compared with the
previous year.
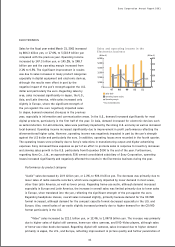
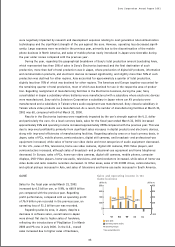
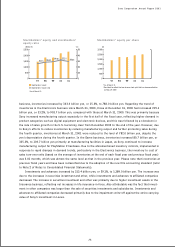
PICTURES
Sales for the fiscal year ended March 31, 2001 increased
by 60.5 billion yen, or 12.2%, to 555.2 billion yen
compared with the previous year. Operating income
decreased by 31.6 billion yen, or 88.0%, to 4.3 billion
yen and the operating margin decreased from 7.3% to
0.8%, primarily due to the adoption of the new film
accounting standard (refer to Note 2 of Notes to
Consolidated Financial Statements). The results in the
Pictures business consist of the results of Sony Pictures
Entertainment (“SPE”), a U.S. based operation.
The sales increase was primarily due to higher
box office revenues from successful current year
motion picture releases as well as the growth of DVD
software sales in the home entertainment business.
However, the sales increase was partly offset by fewer
network television series episodes and lower televi-
sion syndication sales. Regarding profit performance, despite the contribution from higher sales of DVD software,
operating income significantly decreased primarily due to the 28.5 billion yen negative impact from the adoption
of the new film accounting standard (refer to Note 2 of Notes to Consolidated Financial Statements), lower
television syndication sales, and expenses associated with the start-up of online businesses and other strategic
investments in the areas of new digital entertainment initiatives.
Regarding results in the Pictures business on a local currency basis, sales for the fiscal year ended March 31,
2001 increased approximately 12% and operating income decreased approximately 93% compared with the
previous year.
(Billion ¥)
Sales (left)
Operating margin
* Year ended March 31
Operating income (right)
(Billion ¥)
Sales and operating income in the
Pictures business
0
50
100
150
97 98 99 00 01
0
200
400
600
800
0.8%
7.3%
7.1%
5.7%
6.6%