Sony 2001 Annual Report Download - page 78
Download and view the complete annual report
Please find page 78 of the 2001 Sony annual report below. You can navigate through the pages in the report by either clicking on the pages listed below, or by using the keyword search tool below to find specific information within the annual report.-
 1
1 -
2
-
3
-
4
-
5
-
6
-
7
-
8
-
9
-
10
-
11
-
12
-
13
-
14
-
15
-
16
-
17
-
18
-
19
-
20
-
21
-
22
-
23
-
24
-
25
-
26
-
27
-
28
-
29
-
30
-
31
-
32
-
33
-
34
-
35
-
36
-
37
-
38
-
39
-
40
-
41
-
42
-
43
-
44
-
45
-
46
-
47
-
48
-
49
-
50
-
51
-
52
-
53
-
54
-
55
-
56
-
57
-
58
-
59
-
60
-
61
-
62
-
63
-
64
-
65
-
66
-
67
-
 68
68 -
 69
69 -
 70
70 -
 71
71 -
 72
72 -
 73
73 -
 74
74 -
 75
75 -
 76
76 -
 77
77 -
 78
78 -
 79
79 -
 80
80 -
 81
81 -
 82
82 -
 83
83 -
 84
84 -
 85
85 -
 86
86 -
 87
87 -
 88
88 -
89
-
90
-
91
-
92
-
93
-
94
-
95
-
96
-
97
-
98
-
99
-
100
-
101
-
102
-
103
-
104
-
105
-
106
-
107
-
108
-
109
-
110
-
111
-
112
-
113
-
114
-
115
-
116
-
117
-
118
-
119
-
120
-
121
-
122
-
123
-
124
-
125
-
126
-
127
-
128
-
129
-
130
-
131
-
132
-
133
-
134
-
135
-
136
-
137
-
138
-
139
-
140
 |
 |

Sony Corporation Annual Report 2001
76
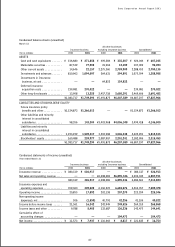
Tangible fixed assets increased by 178.7 billion yen, or 14.2%, to 1,434.3 billion yen. The increase was
primarily due to the fact that capital expenditures were higher than depreciation expenses and sales of tangible
fixed assets during the year, primarily in the Electronics and Game businesses. Capital expenditures (additions to
fixed assets) during the year increased 29.3 billion yen, or 6.7%, to 465.2 billion yen compared with the previous
year. With respect to the capital expenditures by business segment (excluding unallocated amounts), such
expenditures in the Electronics business increased by 60.6 billion yen, or 26.6%, to 287.9 billion yen, primarily due
to higher expenditures for manufacturing equipment for semiconductors and new products; such expenditures in
the Game business decreased by 10.8 billion yen, or 9.1%, to 108.2 billion yen, primarily due to lower expenditures
for manufacturing equipment for semiconductors; such expenditures in the Music business increased by 13.1
billion yen, or 53.3%, to 37.8 billion yen, primarily due to higher expenditures for manufacturing equipment for
DVD discs; such expenditures in the Pictures business decreased by 0.9 billion yen, or 7.8%, to 11.0 billion yen;
such expenditures in the Insurance business decreased by 1.4 billion yen, or 46.8%, to 1.6 billion yen; and such
expenditures in the Other business decreased by 30.7 billion yen, or 64.3%, to 17.1 billion yen.
Other assets increased by 114.6 billion yen, or 10.3%, to 1,229.6 billion yen. Among other assets, deferred
insurance acquisition costs increased due to net increases in life insurance-in-force in the Insurance business.
Total current and long-term liabilities at March 31, 2001 increased by 903.8 billion yen, or 19.7%, to 5,493.5
billion yen compared with the previous fiscal year-end. (It is estimated that total liabilities at March 31, 2001
would have increased by approximately 15% compared with the previous fiscal year-end if the value of the yen had
remained the same at March 31, 2001 as at the previous fiscal year-end.) The increase was primarily attributable
to increases in future insurance policy benefits and other, short-term borrowings, notes and accounts payable,
trade, and accounts payable, other and accrued expenses. Among current liabilities, short-term borrowings
increased 129.1 billion yen, or 228.8%, to 185.5 billion yen. The increase was primarily due to issuances of
commercial paper in the U.S., corresponding to funding requirements for working capital. Current portion of
long-term debt increased 12.3 billion yen, or 7.8%, to 170.8 billion yen. The increase was due to reclassifications
from long-term debt, net of redemption of MTNs and notes in the U.S. Notes and accounts payable, trade increased
114.0 billion yen, or 14.1%, to 925.0 billion yen. Accounts payable, other and accrued expenses increased 126.1
billion yen, or 18.5%, to 807.5 billion yen. The increases in notes and accounts payable, trade and accounts payable,
other and accrued expenses were due to sales increases in the Electronics and Game businesses. Among long-term
liabilities, future insurance policy benefits and other increased due to net increases in life insurance-in-force in the
Insurance business. Accrued pension and severance costs increased 91.2 billion yen, or 70.4%, to 220.8 billion
yen. The increase was primarily because an additional minimum pension liability was recorded, due to decreases
in the current value for pension assets held by Sony Corporation reflecting sluggish stock market conditions in
Japan during the year. Long-term debt increased 29.9 billion yen, or 3.7%, to 843.7 billion yen. The increase was
despite the reclassification of some long-term debt to the current portion of long-term debt, and was due to the
150.0 billion yen of issuance of notes in Japan. As a result, the total of short-term borrowings, the current
portion of long-term debt, and long-term debt increased by 171.3 billion yen, or 16.7%, to 1,200.1 billion yen.
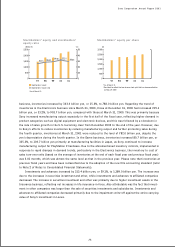
Stockholders’ equity at March 31, 2001 increased by 132.5 billion yen, or 6.1%, to 2,315.5 billion yen
compared with the previous fiscal year-end. The increase was primarily because foreign currency translation
adjustments decreased in amount as a reduction of stockholders’ equity from 483.6 billion yen at the previous
fiscal year-end to 323.3 billion yen, due to the yen’s depreciation. The ratio of stockholders’ equity to total assets
decreased from 32.1% to 29.6%.
For reference, unaudited condensed balance sheets in the Insurance business are presented on page 67.