Sony 2001 Annual Report Download - page 69
Download and view the complete annual report
Please find page 69 of the 2001 Sony annual report below. You can navigate through the pages in the report by either clicking on the pages listed below, or by using the keyword search tool below to find specific information within the annual report.-
 1
1 -
2
-
3
-
4
-
5
-
6
-
7
-
8
-
9
-
10
-
11
-
12
-
13
-
14
-
15
-
16
-
17
-
18
-
19
-
20
-
21
-
22
-
23
-
24
-
25
-
26
-
27
-
28
-
29
-
30
-
31
-
32
-
33
-
34
-
35
-
36
-
37
-
38
-
39
-
40
-
41
-
42
-
43
-
44
-
45
-
46
-
47
-
48
-
49
-
50
-
51
-
52
-
53
-
54
-
55
-
56
-
57
-
58
-
 59
59 -
 60
60 -
 61
61 -
 62
62 -
 63
63 -
 64
64 -
 65
65 -
 66
66 -
 67
67 -
 68
68 -
 69
69 -
 70
70 -
 71
71 -
 72
72 -
 73
73 -
 74
74 -
 75
75 -
 76
76 -
 77
77 -
 78
78 -
 79
79 -
80
-
81
-
82
-
83
-
84
-
85
-
86
-
87
-
88
-
89
-
90
-
91
-
92
-
93
-
94
-
95
-
96
-
97
-
98
-
99
-
100
-
101
-
102
-
103
-
104
-
105
-
106
-
107
-
108
-
109
-
110
-
111
-
112
-
113
-
114
-
115
-
116
-
117
-
118
-
119
-
120
-
121
-
122
-
123
-
124
-
125
-
126
-
127
-
128
-
129
-
130
-
131
-
132
-
133
-
134
-
135
-
136
-
137
-
138
-
139
-
140
 |
 |

Sony Corporation Annual Report 2001
67
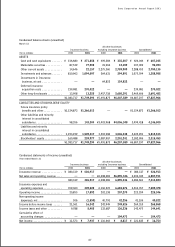
Condensed balance sheets (unaudited)
March 31
All other businesses
Insurance business excluding Insurance business Consolidated
Yen in millions 2000 2001 2000 2001 2000 2001
ASSETS
Cash and cash equivalents . . . . . . . ¥ 216,680 ¥271,858 ¥409,384 ¥335,387 ¥626,064 ¥607,245
Marketable securities . . . . . . . . . . . 87,539 77,905 19,960 12,189 107,499 90,094
Other current assets . . . . . . . . . . . . 14,646 22,157 2,275,360 2,759,909 2,288,453 2,780,135
Investments and advances . . . . . . . 810,963 1,094,097 264,631 294,891 1,075,594 1,388,988
Investments in Insurance
business, at cost . . . . . . . . . . . . . . — —64,822 124,822 ——
Deferred insurance
acquisition costs . . . . . . . . . . . . . . 239,981 270,022 ——239,981 270,022
Other long-lived assets . . . . . . . . . . 13,908 13,255 2,457,718 2,680,391 2,469,606 2,691,482
¥1,383,717 ¥1,749,294 ¥5,491,875 ¥6,207,589 ¥6,807,197 ¥7,827,966
LIABILITIES AND STOCKHOLDERS’ EQUITY
Future insurance policy
benefits and other . . . . . . . . . . . . . ¥1,124,873 ¥1,366,013 ——¥1,124,873 ¥1,366,013
Other liabilities and minority
interest in consolidated
subsidiaries . . . . . . . . . . . . . . . . . . 98,356 143,304 ¥3,403,968 ¥4,006,348 3,499,418 4,146,500
Liabilities and minority
interest in consolidated
subsidiaries . . . . . . . . . . . . . . . . . . 1,223,229 1,509,317 3,403,968 4,006,348 4,624,291 5,512,513
Stockholders’ equity . . . . . . . . . . . . 160,488 239,977 2,087,907 2,201,241 2,182,906 2,315,453
¥1,383,717 ¥1,749,294 ¥5,491,875 ¥6,207,589 ¥6,807,197 ¥7,827,966
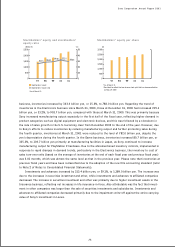
Condensed statements of income (unaudited)
Year ended March 31
All other businesses
Insurance business excluding Insurance business Consolidated
Yen in millions 2000 2001 2000 2001 2000 2001
Insurance revenue . . . . . . . . . . . . . . ¥ 380,319 ¥426,917 ——¥380,317 ¥426,913
Net sales and operating revenue . . . . ——¥6,308,381 ¥6,890,346 6,306,344 6,887,911
380,319 426,917 6,308,381 6,890,346 6,686,661 7,314,824
Insurance expenses and
operating expenses . . . . . . . . . . . . . 359,464 409,025 6,106,223 6,683,076 6,463,457 7,089,478
Operating income . . . . . . . . . . . . . . . 20,855 17,892 202,158 207,270 223,204 225,346
Non-operating income
(expenses), net . . . . . . . . . . . . . . . . . 506 (1,550) 40,791 42,256 41,106 40,522
Income before income taxes . . . . . . 21,361 16,342 242,949 249,526 264,310 265,868
Income taxes and other . . . . . . . . . . 9,788 8,405 132,687 136,236 142,475 144,641
Cumulative effect of
accounting changes . . . . . . . . . . . . — ——104,473 —104,473
Net income . . . . . . . . . . . . . . . . . . . . ¥ 11,573 ¥7,937 ¥110,262 ¥8,817 ¥121,835 ¥16,754