Sony 2001 Annual Report Download - page 61
Download and view the complete annual report
Please find page 61 of the 2001 Sony annual report below. You can navigate through the pages in the report by either clicking on the pages listed below, or by using the keyword search tool below to find specific information within the annual report.-
 1
1 -
2
-
3
-
4
-
5
-
6
-
7
-
8
-
9
-
10
-
11
-
12
-
13
-
14
-
15
-
16
-
17
-
18
-
19
-
20
-
21
-
22
-
23
-
24
-
25
-
26
-
27
-
28
-
29
-
30
-
31
-
32
-
33
-
34
-
35
-
36
-
37
-
38
-
39
-
40
-
41
-
42
-
43
-
44
-
45
-
46
-
47
-
48
-
49
-
50
-
 51
51 -
 52
52 -
 53
53 -
 54
54 -
 55
55 -
 56
56 -
 57
57 -
 58
58 -
 59
59 -
 60
60 -
 61
61 -
 62
62 -
 63
63 -
 64
64 -
 65
65 -
 66
66 -
 67
67 -
 68
68 -
 69
69 -
 70
70 -
 71
71 -
72
-
73
-
74
-
75
-
76
-
77
-
78
-
79
-
80
-
81
-
82
-
83
-
84
-
85
-
86
-
87
-
88
-
89
-
90
-
91
-
92
-
93
-
94
-
95
-
96
-
97
-
98
-
99
-
100
-
101
-
102
-
103
-
104
-
105
-
106
-
107
-
108
-
109
-
110
-
111
-
112
-
113
-
114
-
115
-
116
-
117
-
118
-
119
-
120
-
121
-
122
-
123
-
124
-
125
-
126
-
127
-
128
-
129
-
130
-
131
-
132
-
133
-
134
-
135
-
136
-
137
-
138
-
139
-
140
 |
 |

Sony Corporation Annual Report 2001
59
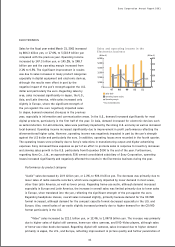
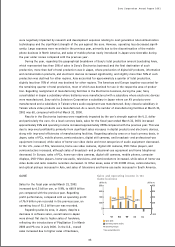
Operating Income
As a result of the factors discussed above, operating
income for the fiscal year ended March 31, 2001
increased by 2.1 billion yen, or 1.0%, to 225.3 billion
yen compared with the previous year. However, the
operating margin decreased from 3.3% to 3.1%.
Operating Performance by Business Segment
The following discussion is based on segment
information. Sales and operating revenue in each
business segment include intersegment transactions.
In the Electronics business, sales and operating
revenue by product category represent sales to
customers, which do not include intersegment
transactions (refer to Note 23 of Notes to
Consolidated Financial Statements).
Sales and operating revenue (left)
(Billion ¥)
Operating margin
* Year ended March 31
Operating income (right)
(Billion ¥)
Sales and operating revenue and
operating income
0
200
400
600
800
1,000
1,200
97 98 99 00 01
0
2,000
4,000
6,000
8,000
3.1%
3.3%
5.0%
7.6%
6.2%
20
21
22
23
24
25
70
71
72
73
74
75
97 98 99 00 01
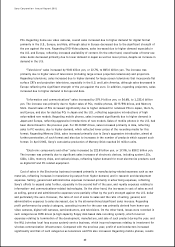
SGA/sales (right)
* Year ended March 31
* Excluding the Insurance business
Cost of sales/sales (left)
(%) (%)
Cost of sales and selling, general and
administrative expenses (SGA), as
percentages of sales
Percentage of sales
* Year ended March 31
* Excluding the Insurance business
Research and development expenses
(Billion ¥) (%)
Research and development expenses
and such expenses as percentage of sales
0
100
200
300
400
500
0
2
4
6
8
10
97 98 99 00 01
6.0%
6.3%
5.8%
4.9%
5.2%