Sony 2001 Annual Report Download - page 70
Download and view the complete annual report
Please find page 70 of the 2001 Sony annual report below. You can navigate through the pages in the report by either clicking on the pages listed below, or by using the keyword search tool below to find specific information within the annual report.-
 1
1 -
2
-
3
-
4
-
5
-
6
-
7
-
8
-
9
-
10
-
11
-
12
-
13
-
14
-
15
-
16
-
17
-
18
-
19
-
20
-
21
-
22
-
23
-
24
-
25
-
26
-
27
-
28
-
29
-
30
-
31
-
32
-
33
-
34
-
35
-
36
-
37
-
38
-
39
-
40
-
41
-
42
-
43
-
44
-
45
-
46
-
47
-
48
-
49
-
50
-
51
-
52
-
53
-
54
-
55
-
56
-
57
-
58
-
59
-
 60
60 -
 61
61 -
 62
62 -
 63
63 -
 64
64 -
 65
65 -
 66
66 -
 67
67 -
 68
68 -
 69
69 -
 70
70 -
 71
71 -
 72
72 -
 73
73 -
 74
74 -
 75
75 -
 76
76 -
 77
77 -
 78
78 -
 79
79 -
 80
80 -
81
-
82
-
83
-
84
-
85
-
86
-
87
-
88
-
89
-
90
-
91
-
92
-
93
-
94
-
95
-
96
-
97
-
98
-
99
-
100
-
101
-
102
-
103
-
104
-
105
-
106
-
107
-
108
-
109
-
110
-
111
-
112
-
113
-
114
-
115
-
116
-
117
-
118
-
119
-
120
-
121
-
122
-
123
-
124
-
125
-
126
-
127
-
128
-
129
-
130
-
131
-
132
-
133
-
134
-
135
-
136
-
137
-
138
-
139
-
140
 |
 |
Sony Corporation Annual Report 2001
68
OTHER
During the fiscal year ended March 31, 2001, the
Other business included Sony Finance International,
Inc., a leasing and credit financing business subsidiary
in Japan; Sony Trading International Corporation, a
subsidiary focused on a parts trading services
business within the Sony group; an advertising
agency business in Japan; location-based entertain-
ment businesses in Japan, the U.S., and Germany;
and satellite distribution-related businesses engaged
in programming and distribution in Japan.
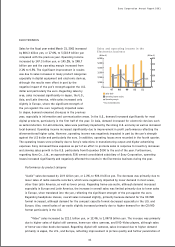
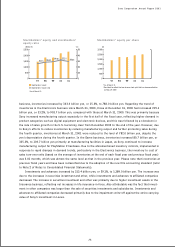
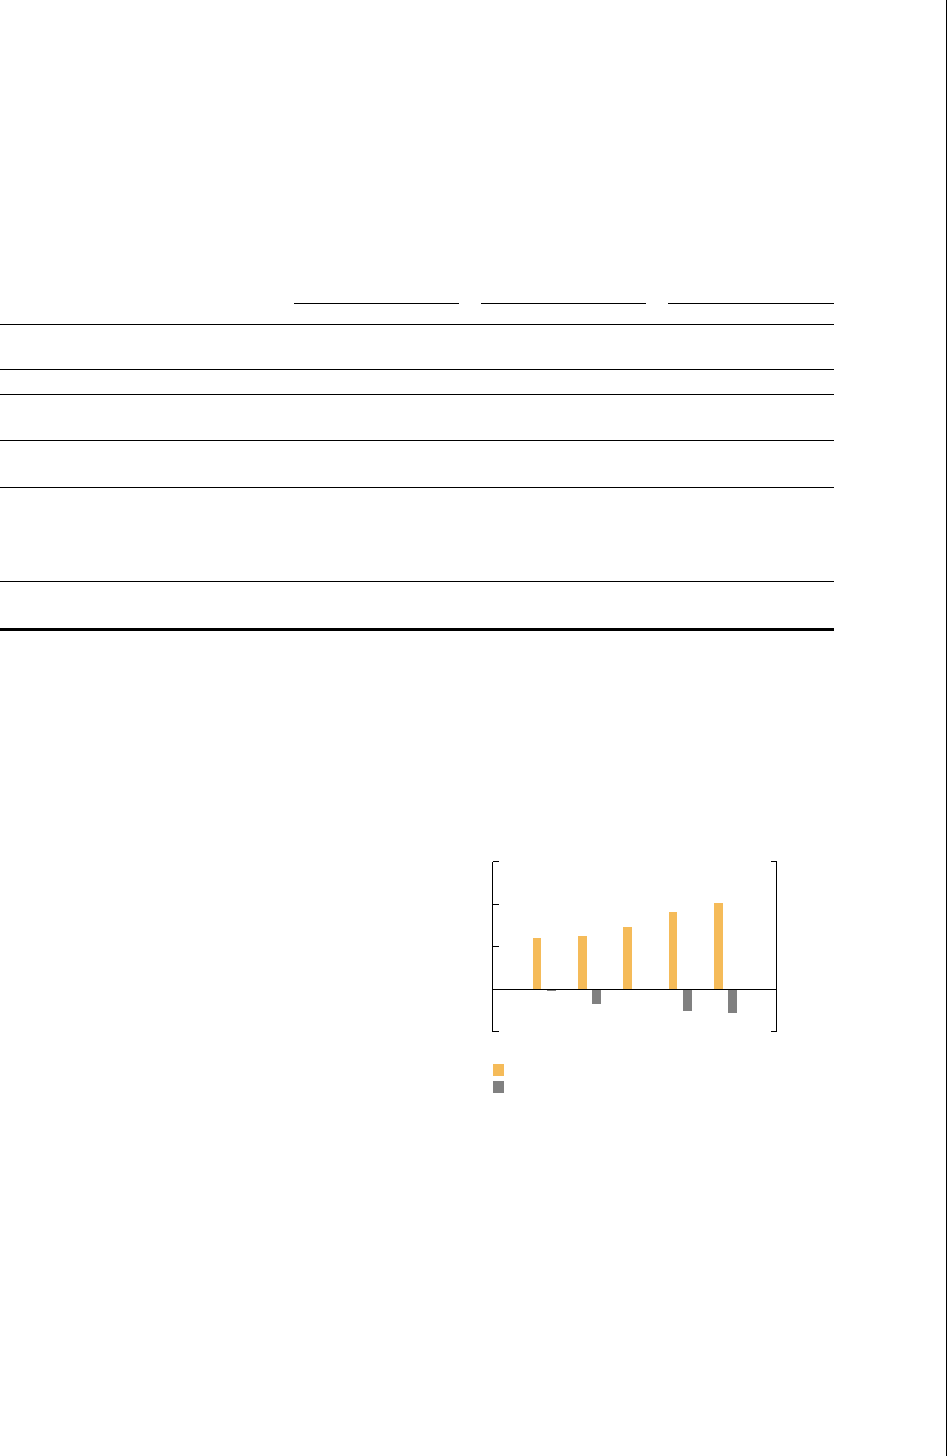
Sales for the fiscal year ended March 31, 2001
increased by 43.6 billion yen, or 12.1%, to 405.1
billion yen, compared with the previous year.
Approximately 70 percent of sales in the Other
business reflected intersegment transactions during
the year. Operating losses increased from 9.9 billion
yen to 11.3 billion yen.
(Billion ¥)
Sales (left)
* Year ended March 31
Operating income (right)
(Billion ¥)
Sales and operating income in the Other
business
-20
0
97 98 99 00 01
0
200
400
600
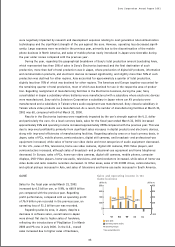
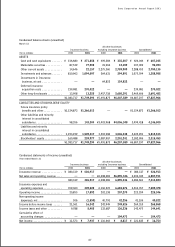
Condensed statements of cash flows (unaudited)
Year ended March 31
All other businesses
Insurance business excluding Insurance business Consolidated
Yen in millions 2000 2001 2000 2001 2000 2001
Net cash provided by operating
activities . . . . . . . . . . . . . . . . . . . . . . . ¥ 202,860 ¥239,549 ¥376,603 ¥305,218 ¥579,463 ¥544,767
Net cash used in investing activities . . . (107,892) (244,411) (351,041) (534,637) (449,893) (719,048)
Net cash provided by (used in)
financing activities . . . . . . . . . . . . . . . 9,474 60,037 (68,509) 134,405 (68,075) 134,442
Effect of exchange rate changes on
cash and cash equivalents . . . . . . . . . . (1) 3(27,640) 21,017 (27,641) 21,020
Net increase (decrease) in cash and
cash equivalents . . . . . . . . . . . . . . . . . 104,441 55,178 (70,587) (73,997) 33,854 (18,819)
Cash and cash equivalents at
beginning of year . . . . . . . . . . . . . . . . 112,239 216,680 479,971 409,384 592,210 626,064
Cash and cash equivalents at end
of year . . . . . . . . . . . . . . . . . . . . . . . . . ¥ 216,680 ¥271,858 ¥409,384 ¥335,387 ¥626,064 ¥607,245