Sony 2001 Annual Report Download - page 63
Download and view the complete annual report
Please find page 63 of the 2001 Sony annual report below. You can navigate through the pages in the report by either clicking on the pages listed below, or by using the keyword search tool below to find specific information within the annual report.-
 1
1 -
2
-
3
-
4
-
5
-
6
-
7
-
8
-
9
-
10
-
11
-
12
-
13
-
14
-
15
-
16
-
17
-
18
-
19
-
20
-
21
-
22
-
23
-
24
-
25
-
26
-
27
-
28
-
29
-
30
-
31
-
32
-
33
-
34
-
35
-
36
-
37
-
38
-
39
-
40
-
41
-
42
-
43
-
44
-
45
-
46
-
47
-
48
-
49
-
50
-
51
-
52
-
 53
53 -
 54
54 -
 55
55 -
 56
56 -
 57
57 -
 58
58 -
 59
59 -
 60
60 -
 61
61 -
 62
62 -
 63
63 -
 64
64 -
 65
65 -
 66
66 -
 67
67 -
 68
68 -
 69
69 -
 70
70 -
 71
71 -
 72
72 -
 73
73 -
74
-
75
-
76
-
77
-
78
-
79
-
80
-
81
-
82
-
83
-
84
-
85
-
86
-
87
-
88
-
89
-
90
-
91
-
92
-
93
-
94
-
95
-
96
-
97
-
98
-
99
-
100
-
101
-
102
-
103
-
104
-
105
-
106
-
107
-
108
-
109
-
110
-
111
-
112
-
113
-
114
-
115
-
116
-
117
-
118
-
119
-
120
-
121
-
122
-
123
-
124
-
125
-
126
-
127
-
128
-
129
-
130
-
131
-
132
-
133
-
134
-
135
-
136
-
137
-
138
-
139
-
140
 |
 |

Sony Corporation Annual Report 2001
61
ELECTRONICS
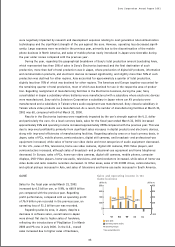
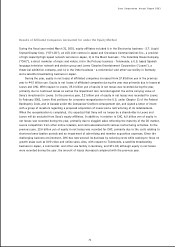
Sales for the fiscal year ended March 31, 2001 increased
by 804.3 billion yen, or 17.0%, to 5,523.9 billion yen
compared with the previous year. Operating income
increased by 147.3 billion yen, or 145.2%, to 248.7
billion yen and the operating margin increased from
2.1% to 4.5%. The significant improvement in results
was due to sales increases in many product categories
especially in digital equipment and electronic devices,
although the results were offset in part by the
negative impact of the yen’s strength against the U.S.
dollar and particularly the euro. Regarding sales by
area, sales increased significantly in Japan, the U.S.,
Asia, and Latin America, while sales increased only
slightly in Europe, where the significant strength of
the yen against the euro negatively impacted sales.
In Japan, demand remained strong as in the previous
year, especially in information and communication areas. In the U.S., demand increased significantly for most
digital products, particularly in the first half of the year. In Asia, demand increased for electronic devices such
as semiconductors. In Latin America, sales were positively impacted by the strong U.S. economy as well as increased
local demand. Operating income increased significantly due to improvement in profit performance reflecting the
aforementioned higher sales. However, operating income was negatively impacted in part by the yen’s strength
against the U.S dollar and particularly the euro. In addition, operating losses were recorded in the fourth quarter.
The operating losses were primarily due to Sony’s reductions in manufacturing output and higher advertising
expenses. Sony increased these expenses as part of an effort to promote sales in response to inventory increases
and slowing sales growth in the U.S. particularly from December 2000 to the end of the year. Furthermore,
regarding Aiwa Co., Ltd., an approximately 51% owned consolidated subsidiary of Sony Corporation, operating
losses increased significantly and negatively affected the results in the Electronics business during the year.
Performance by product category
“Audio” sales decreased by 10.9 billion yen, or 1.2%, to 924.0 billion yen. The decrease was primarily due to
lower sales of radio-cassette recorders, which were negatively impacted by lower demand in most areas,
other than Latin America, as well as lower prices. Regarding home-use audio, although demand increased
especially in Europe and Latin America, the increase in overall sales was limited primarily due to lower sales
in Europe, when translated into the yen, reflecting the significant strength of the yen against the euro.
Regarding headphone stereos, overall sales increased slightly, primarily because demand for the CD/MD
format increased, although demand for the compact cassette format decreased especially in the U.S. and
Europe. Also, overall sales of car audio slightly increased primarily due to higher demand for the CD/MD
format particularly in the U.S.
“Video” sales increased by 121.1 billion yen, or 12.4%, to 1,097.8 billion yen. The increase was primarily
due to higher sales of digital still cameras, home-use video cameras, and DVD-Video players, although sales
of home-use video decks decreased. Regarding digital still cameras, sales increased due to higher demand
primarily in Japan, the U.S., and Europe, reflecting improvement in picture quality and further penetration of
(Billion ¥)
Sales (left)
Operating margin
* Year ended March 31
Operating income (right)
(Billion ¥)
Sales and operating income in the
Electronics business
0
100
200
300
400
500
97 98 99 00 01
0
1,000
2,000
3,000
4,000
5,000
6,000
2.1%
2.6%
6.5%
5.5% 4.5%