Sony 2001 Annual Report Download - page 131
Download and view the complete annual report
Please find page 131 of the 2001 Sony annual report below. You can navigate through the pages in the report by either clicking on the pages listed below, or by using the keyword search tool below to find specific information within the annual report.-
 1
1 -
2
-
3
-
4
-
5
-
6
-
7
-
8
-
9
-
10
-
11
-
12
-
13
-
14
-
15
-
16
-
17
-
18
-
19
-
20
-
21
-
22
-
23
-
24
-
25
-
26
-
27
-
28
-
29
-
30
-
31
-
32
-
33
-
34
-
35
-
36
-
37
-
38
-
39
-
40
-
41
-
42
-
43
-
44
-
45
-
46
-
47
-
48
-
49
-
50
-
51
-
52
-
53
-
54
-
55
-
56
-
57
-
58
-
59
-
60
-
61
-
62
-
63
-
64
-
65
-
66
-
67
-
68
-
69
-
70
-
71
-
72
-
73
-
74
-
75
-
76
-
77
-
78
-
79
-
80
-
81
-
82
-
83
-
84
-
85
-
86
-
87
-
88
-
89
-
90
-
91
-
92
-
93
-
94
-
95
-
96
-
97
-
98
-
99
-
100
-
101
-
102
-
103
-
104
-
105
-
106
-
107
-
108
-
109
-
110
-
111
-
112
-
113
-
114
-
115
-
116
-
117
-
118
-
119
-
120
-
 121
121 -
 122
122 -
 123
123 -
 124
124 -
 125
125 -
 126
126 -
 127
127 -
 128
128 -
 129
129 -
 130
130 -
 131
131 -
 132
132 -
 133
133 -
 134
134 -
 135
135 -
 136
136 -
 137
137 -
 138
138 -
 139
139 -
 140
140
 |
 |

Sony Corporation Annual Report 2001
129
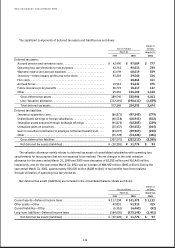
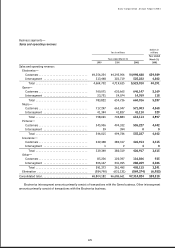
Business segments—
Sales and operating revenue:
Dollars in
Yen in millions millions
Year ended
Year ended March 31 March 31,
1999 2000 2001 2001
Sales and operating revenue:
Electronics—
Customers . . . . . . . . . . . . . . . . . . . . . . . . . . . . . . . . ¥4,356,254 ¥4,395,906 ¥4,998,688 $39,989
Intersegment . . . . . . . . . . . . . . . . . . . . . . . . . . . . . 313,448 323,719 525,222 4,202
Total . . . . . . . . . . . . . . . . . . . . . . . . . . . . . . . . . . 4,669,702 4,719,625 5,523,910 44,191
Game—
Customers . . . . . . . . . . . . . . . . . . . . . . . . . . . . . . . . 760,071 630,662 646,147 5,169
Intersegment . . . . . . . . . . . . . . . . . . . . . . . . . . . . . 23,751 24,074 14,769 118
Total . . . . . . . . . . . . . . . . . . . . . . . . . . . . . . . . . . 783,822 654,736 660,916 5,287
Music—
Customers . . . . . . . . . . . . . . . . . . . . . . . . . . . . . . . . 717,297 665,047 571,003 4,568
Intersegment . . . . . . . . . . . . . . . . . . . . . . . . . . . . . 41,394 41,837 41,110 329
Total . . . . . . . . . . . . . . . . . . . . . . . . . . . . . . . . . . 758,691 706,884 612,113 4,897
Pictures—
Customers . . . . . . . . . . . . . . . . . . . . . . . . . . . . . . . . 545,956 494,332 555,227 4,442
Intersegment . . . . . . . . . . . . . . . . . . . . . . . . . . . . . 59 394 00
Total . . . . . . . . . . . . . . . . . . . . . . . . . . . . . . . . . . 546,015 494,726 555,227 4,442
Insurance—
Customers . . . . . . . . . . . . . . . . . . . . . . . . . . . . . . . . 339,368 380,317 426,913 3,415
Intersegment . . . . . . . . . . . . . . . . . . . . . . . . . . . . . 1 2 40
Total . . . . . . . . . . . . . . . . . . . . . . . . . . . . . . . . . . 339,369 380,319 426,917 3,415
Other—
Customers . . . . . . . . . . . . . . . . . . . . . . . . . . . . . . . . 85,236 120,397 116,846 935
Intersegment . . . . . . . . . . . . . . . . . . . . . . . . . . . . . 206,137 241,095 288,269 2,306
Total . . . . . . . . . . . . . . . . . . . . . . . . . . . . . . . . . . 291,373 361,492 405,115 3,241
Elimination . . . . . . . . . . . . . . . . . . . . . . . . . . . . . . . . . (584,790) (631,121) (869,374) (6,955)
Consolidated total . . . . . . . . . . . . . . . . . . . . . . . . . . . . . . ¥6,804,182 ¥6,686,661 ¥7,314,824 $58,518
Electronics intersegment amounts primarily consist of transactions with the Game business. Other intersegment
amounts primarily consist of transactions with the Electronics business.