Sony 2001 Annual Report Download - page 124
Download and view the complete annual report
Please find page 124 of the 2001 Sony annual report below. You can navigate through the pages in the report by either clicking on the pages listed below, or by using the keyword search tool below to find specific information within the annual report.-
 1
1 -
2
-
3
-
4
-
5
-
6
-
7
-
8
-
9
-
10
-
11
-
12
-
13
-
14
-
15
-
16
-
17
-
18
-
19
-
20
-
21
-
22
-
23
-
24
-
25
-
26
-
27
-
28
-
29
-
30
-
31
-
32
-
33
-
34
-
35
-
36
-
37
-
38
-
39
-
40
-
41
-
42
-
43
-
44
-
45
-
46
-
47
-
48
-
49
-
50
-
51
-
52
-
53
-
54
-
55
-
56
-
57
-
58
-
59
-
60
-
61
-
62
-
63
-
64
-
65
-
66
-
67
-
68
-
69
-
70
-
71
-
72
-
73
-
74
-
75
-
76
-
77
-
78
-
79
-
80
-
81
-
82
-
83
-
84
-
85
-
86
-
87
-
88
-
89
-
90
-
91
-
92
-
93
-
94
-
95
-
96
-
97
-
98
-
99
-
100
-
101
-
102
-
103
-
104
-
105
-
106
-
107
-
108
-
109
-
110
-
111
-
112
-
113
-
 114
114 -
 115
115 -
 116
116 -
 117
117 -
 118
118 -
 119
119 -
 120
120 -
 121
121 -
 122
122 -
 123
123 -
 124
124 -
 125
125 -
 126
126 -
 127
127 -
 128
128 -
 129
129 -
 130
130 -
 131
131 -
 132
132 -
 133
133 -
 134
134 -
135
-
136
-
137
-
138
-
139
-
140
 |
 |

Sony Corporation Annual Report 2001
122
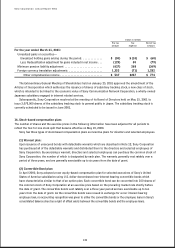
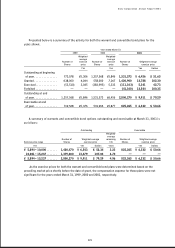
In accordance with FAS No. 123 “Accounting for Stock-Based Compensation”, Sony has elected to account for
stock-based compensation under the provisions of APB No. 25 for both the warrant and convertible bond plans.
Had compensation for Sony’s warrant and convertible bond plans been recognized based on the fair value on the
grant date under the methodology prescribed by FAS No. 123, Sony’s net income and net income per share for the
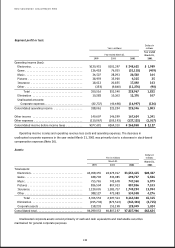
years ended March 31, 1999, 2000 and 2001 would have been impacted as shown in the following table:
Year ended March 31
1999 2000 2001 2001
Dollars in
Yen in millions millions
Income before cumulative effect of accounting changes:
As reported . . . . . . . . . . . . . . . . . . . . . . . . . . . . . . . . . . . . ¥179,004 ¥121,835 ¥121,227 $970
Pro forma . . . . . . . . . . . . . . . . . . . . . . . . . . . . . . . . . . . . . 178,505 121,191 118,524 948
Net income:
As reported . . . . . . . . . . . . . . . . . . . . . . . . . . . . . . . . . . . . ¥179,004 ¥121,835 ¥16,754 $134
Pro forma . . . . . . . . . . . . . . . . . . . . . . . . . . . . . . . . . . . . . 178,505 121,191 14,051 112
Yen Dollars
Income before cumulative effect of accounting changes:
—Basic EPS:
As reported . . . . . . . . . . . . . . . . . . . . . . . . . . . . . . . . . . ¥ 218.43 ¥144.58 ¥132.64 $1.06
Pro forma . . . . . . . . . . . . . . . . . . . . . . . . . . . . . . . . . . . 217.82 143.82 129.69 1.04
—Diluted EPS:
As reported . . . . . . . . . . . . . . . . . . . . . . . . . . . . . . . . . . 195.51 131.70 124.36 0.99
Pro forma . . . . . . . . . . . . . . . . . . . . . . . . . . . . . . . . . . . 194.97 131.02 121.64 0.97
Net income:
—Basic EPS:
As reported . . . . . . . . . . . . . . . . . . . . . . . . . . . . . . . . . . ¥ 218.43 ¥144.58 ¥ 18.33 $0.15
Pro forma . . . . . . . . . . . . . . . . . . . . . . . . . . . . . . . . . . . 217.82 143.82 15.37 0.12
—Diluted EPS:
As reported . . . . . . . . . . . . . . . . . . . . . . . . . . . . . . . . . . 195.51 131.70 19.28 0.15
Pro forma . . . . . . . . . . . . . . . . . . . . . . . . . . . . . . . . . . . 194.97 131.02 16.56 0.13
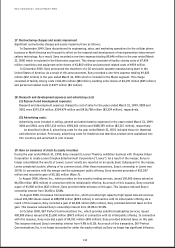
The weighted-average fair value per share at the date of grant for warrants and convertible bond options
granted during the years ended March 31, 1999, 2000 and 2001 was ¥896, ¥1,398 and ¥4,111 ($32.89),
respectively. The fair value of warrants and convertible bond options granted on the date of grant, which is
amortized to expense over the vesting period in determining the pro forma impact, is estimated using the
Black-Scholes option-pricing model with the following weighted-average assumptions:
Year ended March 31
Weighted-average assumptions 1999 2000 2001
Risk-free interest rate . . . . . . . . . . . . . . . . . . . . . . . . . . . . . . . . 0.80% 0.60% 2.68%
Expected lives . . . . . . . . . . . . . . . . . . . . . . . . . . . . . . . . . . . . . . 2.78 Years 2.78 Years 3.26 Years
Expected volatility . . . . . . . . . . . . . . . . . . . . . . . . . . . . . . . . . . 24.42% 33.12% 44.07%
Expected dividend . . . . . . . . . . . . . . . . . . . . . . . . . . . . . . . . . . . 0.46% 0.40% 0.21%