Sony 2001 Annual Report Download - page 133
Download and view the complete annual report
Please find page 133 of the 2001 Sony annual report below. You can navigate through the pages in the report by either clicking on the pages listed below, or by using the keyword search tool below to find specific information within the annual report.-
 1
1 -
2
-
3
-
4
-
5
-
6
-
7
-
8
-
9
-
10
-
11
-
12
-
13
-
14
-
15
-
16
-
17
-
18
-
19
-
20
-
21
-
22
-
23
-
24
-
25
-
26
-
27
-
28
-
29
-
30
-
31
-
32
-
33
-
34
-
35
-
36
-
37
-
38
-
39
-
40
-
41
-
42
-
43
-
44
-
45
-
46
-
47
-
48
-
49
-
50
-
51
-
52
-
53
-
54
-
55
-
56
-
57
-
58
-
59
-
60
-
61
-
62
-
63
-
64
-
65
-
66
-
67
-
68
-
69
-
70
-
71
-
72
-
73
-
74
-
75
-
76
-
77
-
78
-
79
-
80
-
81
-
82
-
83
-
84
-
85
-
86
-
87
-
88
-
89
-
90
-
91
-
92
-
93
-
94
-
95
-
96
-
97
-
98
-
99
-
100
-
101
-
102
-
103
-
104
-
105
-
106
-
107
-
108
-
109
-
110
-
111
-
112
-
113
-
114
-
115
-
116
-
117
-
118
-
119
-
120
-
121
-
122
-
 123
123 -
 124
124 -
 125
125 -
 126
126 -
 127
127 -
 128
128 -
 129
129 -
 130
130 -
 131
131 -
 132
132 -
 133
133 -
 134
134 -
 135
135 -
 136
136 -
 137
137 -
 138
138 -
 139
139 -
 140
140
 |
 |

Sony Corporation Annual Report 2001
131
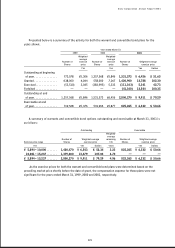
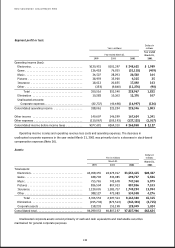
Other significant items:
Dollars in
Yen in millions millions
Year ended
Year ended March 31 March 31,
1999 2000 2001 2001
Depreciation and amortization:
Electronics . . . . . . . . . . . . . . . . . . . . . . . . . . . . . . . . . . ¥218,608 ¥212,275 ¥214,769 $1,718
Game . . . . . . . . . . . . . . . . . . . . . . . . . . . . . . . . . . . . . . 3,895 13,414 37,497 300
Music . . . . . . . . . . . . . . . . . . . . . . . . . . . . . . . . . . . . . . 34,523 32,807 34,648 277
Pictures . . . . . . . . . . . . . . . . . . . . . . . . . . . . . . . . . . . . 11,377 10,599 11,853 95
Insurance, including deferred insurance
acquisition costs . . . . . . . . . . . . . . . . . . . . . . . . . . . . 21,085 23,699 40,278 322
Other . . . . . . . . . . . . . . . . . . . . . . . . . . . . . . . . . . . . . . 15,354 10,666 7,218 58
Total . . . . . . . . . . . . . . . . . . . . . . . . . . . . . . . . . . . . 304,842 303,460 346,263 2,770
Corporate . . . . . . . . . . . . . . . . . . . . . . . . . . . . . . . . . . 2,331 3,045 2,005 16
Consolidated total . . . . . . . . . . . . . . . . . . . . . . . . . . . . . . ¥307,173 ¥306,505 ¥348,268 $2,786
Capital expenditures for segment assets:
Electronics . . . . . . . . . . . . . . . . . . . . . . . . . . . . . . . . . . ¥252,363 ¥227,322 ¥287,883 $2,303
Game . . . . . . . . . . . . . . . . . . . . . . . . . . . . . . . . . . . . . . 3,941 118,960 108,168 865
Music . . . . . . . . . . . . . . . . . . . . . . . . . . . . . . . . . . . . . . 45,222 24,644 37,776 302
Pictures . . . . . . . . . . . . . . . . . . . . . . . . . . . . . . . . . . . . 10,988 11,947 11,020 88
Insurance . . . . . . . . . . . . . . . . . . . . . . . . . . . . . . . . . . 836 2,979 1,586 13
Other . . . . . . . . . . . . . . . . . . . . . . . . . . . . . . . . . . . . . . 36,333 47,801 17,086 137
Total . . . . . . . . . . . . . . . . . . . . . . . . . . . . . . . . . . . . 349,683 433,653 463,519 3,708
Corporate . . . . . . . . . . . . . . . . . . . . . . . . . . . . . . . . . . 4,047 2,234 1,690 14
Consolidated total . . . . . . . . . . . . . . . . . . . . . . . . . . . . . . ¥353,730 ¥435,887 ¥465,209 $3,722
The capital expenditures in the above table represent the additions to fixed assets of each segment.
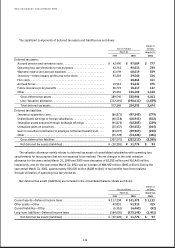
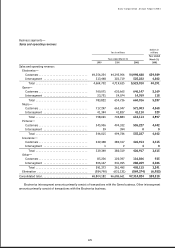
The following table is a breakdown of Electronics sales and operating revenue to external customers by product
category. The Electronics business is managed as a single operating segment by Sony’s management.
Dollars in
Yen in millions millions
Year ended
Year ended March 31 March 31,
1999 2000 2001 2001
Audio . . . . . . . . . . . . . . . . . . . . . . . . . . . . . . . . . . . . . . . . ¥1,072,621 ¥934,865 ¥923,968 $ 7,391
Video . . . . . . . . . . . . . . . . . . . . . . . . . . . . . . . . . . . . . . . . 969,129 976,705 1,097,847 8,783
Televisions . . . . . . . . . . . . . . . . . . . . . . . . . . . . . . . . . . . 702,620 714,188 805,028 6,440
Information and Communications . . . . . . . . . . . . . . . . . 914,140 1,052,707 1,332,619 10,661
Electronic components and other . . . . . . . . . . . . . . . . . . 697,744 717,441 839,226 6,714
Total . . . . . . . . . . . . . . . . . . . . . . . . . . . . . . . . . . . . ¥4,356,254 ¥4,395,906 ¥4,998,688 $39,989