Sony 2001 Annual Report Download - page 65
Download and view the complete annual report
Please find page 65 of the 2001 Sony annual report below. You can navigate through the pages in the report by either clicking on the pages listed below, or by using the keyword search tool below to find specific information within the annual report.-
 1
1 -
2
-
3
-
4
-
5
-
6
-
7
-
8
-
9
-
10
-
11
-
12
-
13
-
14
-
15
-
16
-
17
-
18
-
19
-
20
-
21
-
22
-
23
-
24
-
25
-
26
-
27
-
28
-
29
-
30
-
31
-
32
-
33
-
34
-
35
-
36
-
37
-
38
-
39
-
40
-
41
-
42
-
43
-
44
-
45
-
46
-
47
-
48
-
49
-
50
-
51
-
52
-
53
-
54
-
 55
55 -
 56
56 -
 57
57 -
 58
58 -
 59
59 -
 60
60 -
 61
61 -
 62
62 -
 63
63 -
 64
64 -
 65
65 -
 66
66 -
 67
67 -
 68
68 -
 69
69 -
 70
70 -
 71
71 -
 72
72 -
 73
73 -
 74
74 -
 75
75 -
76
-
77
-
78
-
79
-
80
-
81
-
82
-
83
-
84
-
85
-
86
-
87
-
88
-
89
-
90
-
91
-
92
-
93
-
94
-
95
-
96
-
97
-
98
-
99
-
100
-
101
-
102
-
103
-
104
-
105
-
106
-
107
-
108
-
109
-
110
-
111
-
112
-
113
-
114
-
115
-
116
-
117
-
118
-
119
-
120
-
121
-
122
-
123
-
124
-
125
-
126
-
127
-
128
-
129
-
130
-
131
-
132
-
133
-
134
-
135
-
136
-
137
-
138
-
139
-
140
 |
 |

Sony Corporation Annual Report 2001
63
were negatively impacted by research and development expenses relating to next-generation telecommunication
technologies and the significant strength of the yen against the euro. However, operating loss decreased signifi-
cantly. Large expenses were recorded in the previous year, primarily due to the discontinuation of the mobile
phone business in North America, and sales of mobile phones newly introduced in Japan were favorable during
the year under review compared with the previous year.
During the year, regarding the geographical breakdown of Sony’s total production amount (excluding Aiwa,
which represented less than 10% of sales in Sony’s Electronics business) and the final destination of such
production, more than half of total production was in Japan, where production of digital AV products, information
and communication products, and electronic devices increased significantly, and slightly more than 50% of such
production was destined for other regions. Asia accounted for approximately a quarter of total production,
slightly less than 70% of which was destined for other regions. The Americas and Europe together accounted for
the remaining quarter of total production, most of which was destined for use in the respective area of produc-
tion. Regarding realignment of manufacturing facilities in the Electronics business, during the year, Sony
consolidated in Japan a subsidiary where batteries were manufactured with a subsidiary where electronic devices
were manufactured. Sony sold to Solectron Corporation a subsidiary in Japan where car AV products were
manufactured and a subsidiary in Taiwan where audio equipment was manufactured. Sony closed a subsidiary in
Taiwan where video products were manufactured. As a result, the number of manufacturing facilities at March 31,
2001 was 60, compared with 64 at March 31, 2000.
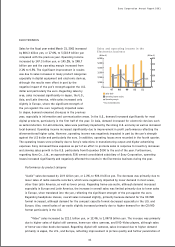
Results in the Electronics business were negatively impacted by the yen’s strength against the U.S. dollar
and particularly the euro. On a local currency basis, sales for the fiscal year ended March 31, 2001 increased
approximately 21% and operating income increased approximately 249% compared with the previous year. This was
due to improved profitability primarily from significant sales increases in digital products and electronic devices,
along with improved efficiencies of manufacturing facilities. Regarding sales by area on a local currency basis, in
Japan, sales of PCs, mobile phones, semiconductors, digital still cameras, and broadcast- and professional-use
equipment increased, while sales of home-use video decks and most categories of audio equipment decreased.
In the U.S., sales of PCs, televisions, home-use video cameras, digital still cameras, DVD-Video players, and
semiconductors increased, although sales of broadcast- and professional-use equipment and home telephones
decreased. In Europe, sales of PCs, home-use video cameras, digital still cameras, mobile phones, computer
displays, DVD-Video players, home-use audio, televisions, and semiconductors increased, while sales of home-use
video decks and radio cassette recorders decreased. In Other areas, sales of CD-R/RW drives, semiconductors,
and optical pickups increased in Asia, and sales of televisions and home-use audio increased in South America.
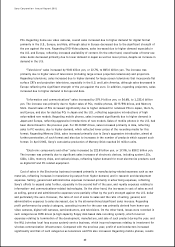
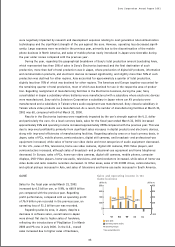
GAME
Sales for the fiscal year ended March 31, 2001
increased by 6.2 billion yen, or 0.9%, to 660.9 billion
yen compared with the previous year. Regarding
profit performance, compared with an operating profit
of 76.9 billion yen recorded in the previous year, an
operating loss of 51.1 billion yen was recorded.
Regarding sales by area, in Japan, despite a
decrease in software sales, overall sales in Japan
were almost flat due to higher sales of hardware,
reflecting the introductions of PlayStation 2 in March
2000 and PS one in July 2000. In the U.S., overall
sales increased due to higher sales of hardware,
(Billion ¥)
Sales (left)
Operating margin
* Year ended March 31
Operating income (right)
(Billion ¥)
Sales and operating income in the
Game business
-100
0
100
200
300
400
97 98 99 00 01
0
200
400
600
800
11.8%
17.4%
16.1%
13.6%