Sony 2001 Annual Report Download - page 74
Download and view the complete annual report
Please find page 74 of the 2001 Sony annual report below. You can navigate through the pages in the report by either clicking on the pages listed below, or by using the keyword search tool below to find specific information within the annual report.-
 1
1 -
2
-
3
-
4
-
5
-
6
-
7
-
8
-
9
-
10
-
11
-
12
-
13
-
14
-
15
-
16
-
17
-
18
-
19
-
20
-
21
-
22
-
23
-
24
-
25
-
26
-
27
-
28
-
29
-
30
-
31
-
32
-
33
-
34
-
35
-
36
-
37
-
38
-
39
-
40
-
41
-
42
-
43
-
44
-
45
-
46
-
47
-
48
-
49
-
50
-
51
-
52
-
53
-
54
-
55
-
56
-
57
-
58
-
59
-
60
-
61
-
62
-
63
-
 64
64 -
 65
65 -
 66
66 -
 67
67 -
 68
68 -
 69
69 -
 70
70 -
 71
71 -
 72
72 -
 73
73 -
 74
74 -
 75
75 -
 76
76 -
 77
77 -
 78
78 -
 79
79 -
 80
80 -
 81
81 -
 82
82 -
 83
83 -
 84
84 -
85
-
86
-
87
-
88
-
89
-
90
-
91
-
92
-
93
-
94
-
95
-
96
-
97
-
98
-
99
-
100
-
101
-
102
-
103
-
104
-
105
-
106
-
107
-
108
-
109
-
110
-
111
-
112
-
113
-
114
-
115
-
116
-
117
-
118
-
119
-
120
-
121
-
122
-
123
-
124
-
125
-
126
-
127
-
128
-
129
-
130
-
131
-
132
-
133
-
134
-
135
-
136
-
137
-
138
-
139
-
140
 |
 |

Sony Corporation Annual Report 2001
72
Minority Interest in Income (Loss) of Consolidated Subsidiaries
In the fiscal year ended March 31, 2001, regarding minority interest in income (loss) of consolidated subsidiaries,
which is excluded from income before income taxes, 15.3 billion yen of minority interest in loss of consolidated
subsidiaries was recorded, which increased net income by the same amount. This was primarily due to minority
shareholder’s interest in the net losses of Aiwa Co., Ltd., an approximately 51% owned subsidiary of Sony Corporation.
In the previous year, 10.0 billion yen of minority interest in income of consolidated subsidiaries was recorded,
which decreased net income by the same amount. This was primarily due to minority shareholder’s interest in
the net income of SMEJ, for the period prior to the acquisition transactions of three listed subsidiaries (refer to
Note 4 of Notes to Consolidated Financial Statements), which was due to the favorable results of Sony Computer
Entertainment (“SCE”), which was at that time an approximately 50% owned subsidiary of SMEJ.
Income before Cumulative Effect of Accounting Changes
Income before cumulative effect of accounting changes for the fiscal year ended March 31, 2001 decreased by
0.6 billion yen, or 0.5%, to 121.2 billion yen compared with the previous year, due to the factors discussed above.
As a percentage of sales, income before cumulative effect of accounting changes decreased from 1.8% to 1.7%.
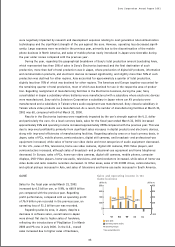
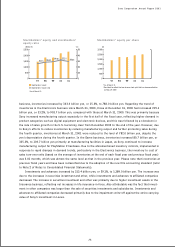
Net Income
Net income for the fiscal year ended March 31, 2001 decreased by 105.1 billion yen, or 86.2%, to 16.8 billion yen
compared with the previous year. As a percentage of sales, net income decreased from 1.8% to 0.2%, and the
return on stockholders’ equity (based on the average of such amounts at the end of each fiscal year and previous
fiscal year) decreased from 6.1% to 0.7%. The decrease in net income was primarily due to the 104.5 billion yen
one-time cumulative effect of accounting changes, relating to the adoption of the new film accounting standard
(refer to Note 2 of Notes to Consolidated Financial Statements) and the accounting standard regarding revenue
recognition (refer to Note 2 of Notes to Consolidated Financial Statements), as well as the increase in equity in
net losses of affiliated companies, partially offset by the aforementioned positive impact from minority interest in
income (loss) of consolidated subsidiaries.
Basic net income per share was 18.3 yen compared with 144.6 yen in the previous year, and diluted net
income per share was 19.3 yen compared with 131.7 yen in the previous year (refer to Note 2 of Notes to
Consolidated Financial Statements).
ROE
* Year ended March 31
Net income
(Billion ¥) (%)
Net income and ROE
0
50
100
150
200
250
0
5
10
15
20
25
97 98 99 00 01
0.7%
6.1%
9.8%
13.6%
10.6%
Diluted
* Year ended March 31
* Restated to reflect the two-for-one stock split that has become effective
on May 19, 2000
Basic
(¥)
Net income per share
97 98 99 00 01
0
100
200
300