Sony 2001 Annual Report Download - page 89
Download and view the complete annual report
Please find page 89 of the 2001 Sony annual report below. You can navigate through the pages in the report by either clicking on the pages listed below, or by using the keyword search tool below to find specific information within the annual report.-
 1
1 -
2
-
3
-
4
-
5
-
6
-
7
-
8
-
9
-
10
-
11
-
12
-
13
-
14
-
15
-
16
-
17
-
18
-
19
-
20
-
21
-
22
-
23
-
24
-
25
-
26
-
27
-
28
-
29
-
30
-
31
-
32
-
33
-
34
-
35
-
36
-
37
-
38
-
39
-
40
-
41
-
42
-
43
-
44
-
45
-
46
-
47
-
48
-
49
-
50
-
51
-
52
-
53
-
54
-
55
-
56
-
57
-
58
-
59
-
60
-
61
-
62
-
63
-
64
-
65
-
66
-
67
-
68
-
69
-
70
-
71
-
72
-
73
-
74
-
75
-
76
-
77
-
78
-
 79
79 -
 80
80 -
 81
81 -
 82
82 -
 83
83 -
 84
84 -
 85
85 -
 86
86 -
 87
87 -
 88
88 -
 89
89 -
 90
90 -
 91
91 -
 92
92 -
 93
93 -
 94
94 -
 95
95 -
 96
96 -
 97
97 -
 98
98 -
 99
99 -
100
-
101
-
102
-
103
-
104
-
105
-
106
-
107
-
108
-
109
-
110
-
111
-
112
-
113
-
114
-
115
-
116
-
117
-
118
-
119
-
120
-
121
-
122
-
123
-
124
-
125
-
126
-
127
-
128
-
129
-
130
-
131
-
132
-
133
-
134
-
135
-
136
-
137
-
138
-
139
-
140
 |
 |

Sony Corporation Annual Report 2001
87
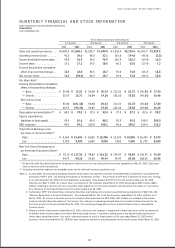
QUARTERLY FINANCIAL AND STOCK INFORMATION
Sony Corporation and Consolidated Subsidiaries
(Unaudited)
Year ended March 31
Ye n in billions except per share amounts
1st Quarter 2nd Quarter 3rd Quarter 4th Quarter
2000 2001 2000 2001 2000 2001 2000 2001
Sales and operating revenue . . . . ¥1,482.3 ¥1,565.1 ¥1,632.7 ¥1,690.9 ¥1,916.0 ¥2,129.6 ¥1,655.7 ¥1,929.2
Operating income (loss) . . . . . . . 41.2 30.6 66.0 53.1 161.6 144.8 (45.6) (3.2)
Income (loss) before income taxes
. . 42.8 36.9 90.0 76.9 165.9 136.2 (34.4) 16.0
Income taxes . . . . . . . . . . . . . . . 17.1 17.2 34.7 38.0 60.3 53.0 (17.4) 7.3
Income
(loss)
before cumulative
effect of accounting changes . . 18.4 12.0 46.5 18.7 93.6 74.8 (36.7) 15.8
Net income (loss) . . . . . . . . . . . . 18.4 (92.4) 46.5 18.7 93.6 74.8 (36.7) 15.8
Per share data*
Income (loss) before cumulative
effect of accounting changes
— Basic . . . . . . . . . . . . . . . . . . ¥ 22.46 ¥13.21 ¥ 56.48 ¥20.43 ¥ 113.31 ¥81.72 ¥ (40.80) ¥17.20
— Diluted . . . . . . . . . . . . . . . . 20.57 12.71 50.84 19.38 101.62 75.82 (40.80) 16.46
Net income (loss)
— Basic . . . . . . . . . . . . . . . . . . 22.46 (101.48) 56.48 20.43 113.31 81.72 (40.80) 17.20
— Diluted . . . . . . . . . . . . . . . . 20.57 (92.34) 50.84 19.38 101.62 75.82 (40.80) 16.46
Depreciation and amortization** . . ¥ 68.5 ¥79.8 ¥ 72.9 ¥83.0 ¥ 77.5 ¥87.2 ¥ 87.6 ¥98.2
Capital expenditures
(additions to fixed assets) . . . . . . 93.4 81.6 99.0 88.2 95.5 90.5 148.0 205.0
R&D expenses . . . . . . . . . . . . . . . 90.2 90.3 103.8 108.1 90.6 100.0 109.9 118.3
Tokyo Stock Exchange price
per share of Common Stock*:
High . . . . . . . . . . . . . . . . . . . . . ¥ 6,650 ¥15,000 ¥ 8,625 ¥12,480 ¥ 15,150 ¥10,800 ¥16,300 ¥9,370
Low . . . . . . . . . . . . . . . . . . . . . 5,425 9,490 6,690 9,900 7,605 7,560 11,725 8,040
New York Stock Exchange price
per American Depositary Share*:
High . . . . . . . . . . . . . . . . . . . . . $ 55.19 $137.56 $ 78.69 $ 116.25 $ 144.97 $ 98.69 $156.75 $ 76.90
Low . . . . . . . . . . . . . . . . . . . . . 44.72 90.25 55.56 90.44 72.47 69.38 108.00 65.95
* All per share data have been adjusted for all periods to reflect the two-for-one stock split that has been completed on May 19, 2000. Stock price
data are based on daily closing prices.
** Including amortization expenses for intangible assets and for deferred insurance acquisition costs.
Notes: 1. In June 2000, the Accounting Standards Executive Committee of the American Institute of Certified Public Accountants issued Statement
of Position (“SOP”) 00-2, “Accounting by Producers or Distributors of Films.” The provision of SOP 00-2 is effective for fiscal years starting
on or after December 16, 2000 with early application encouraged. Sony adopted SOP 00-2 in the first quarter ended June 30, 2000,
effective as of April 1, 2000. As a result, Sony’s net income for the fiscal year ended March 31, 2001 decreased by ¥101.7 billion ($813
million), reflecting a one-time non-cash cumulative effect adjustment in the income statement directly above the caption of “net income”
for a change in accounting principle in the first quarter ended June 30, 2000.
2. In December 1999, the United States of America Securities and Exchange Commission issued Staff Accounting Bulletin (“SAB”) No. 101,
“Revenue Recognition in Financial Statements.” Sony adopted SAB No. 101 in the fourth quarter ended March 31, 2001, effective as of
April 1, 2000. As a result, a one-time non-cash cumulative effect adjustment of ¥2.8 billion ($23 million) was recorded in the income
statement directly above the caption of “net income” for a change in accounting principle. Sony has restated its financial results for the
first three quarters of the year ended March 31, 2001. The accounting change did not have a material effect on Sony’s consolidated
financial results.
3. Effective with the fourth quarter ended March 31, 2001, net loss on sale, disposal or impairment of long-lived assets, which was previously
included in other income/expense and shown below operating income, is included in selling, general and administrative expense and
shown above operating income. As a result, operating income for the first three quarters of the year ended March 31, 2001 and all
quarters of the year ended March 31, 2000 has been restated to conform to the presentation for the fourth quarter ended March 31, 2001.