Sony 2001 Annual Report Download - page 135
Download and view the complete annual report
Please find page 135 of the 2001 Sony annual report below. You can navigate through the pages in the report by either clicking on the pages listed below, or by using the keyword search tool below to find specific information within the annual report.-
 1
1 -
2
-
3
-
4
-
5
-
6
-
7
-
8
-
9
-
10
-
11
-
12
-
13
-
14
-
15
-
16
-
17
-
18
-
19
-
20
-
21
-
22
-
23
-
24
-
25
-
26
-
27
-
28
-
29
-
30
-
31
-
32
-
33
-
34
-
35
-
36
-
37
-
38
-
39
-
40
-
41
-
42
-
43
-
44
-
45
-
46
-
47
-
48
-
49
-
50
-
51
-
52
-
53
-
54
-
55
-
56
-
57
-
58
-
59
-
60
-
61
-
62
-
63
-
64
-
65
-
66
-
67
-
68
-
69
-
70
-
71
-
72
-
73
-
74
-
75
-
76
-
77
-
78
-
79
-
80
-
81
-
82
-
83
-
84
-
85
-
86
-
87
-
88
-
89
-
90
-
91
-
92
-
93
-
94
-
95
-
96
-
97
-
98
-
99
-
100
-
101
-
102
-
103
-
104
-
105
-
106
-
107
-
108
-
109
-
110
-
111
-
112
-
113
-
114
-
115
-
116
-
117
-
118
-
119
-
120
-
121
-
122
-
123
-
124
-
 125
125 -
 126
126 -
 127
127 -
 128
128 -
 129
129 -
 130
130 -
 131
131 -
 132
132 -
 133
133 -
 134
134 -
 135
135 -
 136
136 -
 137
137 -
 138
138 -
 139
139 -
 140
140
 |
 |

Sony Corporation Annual Report 2001
133
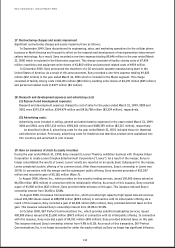
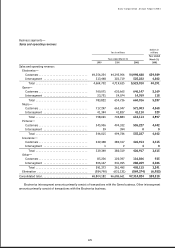
The following information shows sales and operating revenue and operating income by geographic origin for
the years ended March 31, 1999, 2000 and 2001. In addition to the disclosure requirements under FAS No. 131,
Sony discloses this supplemental information in accordance with disclosure requirements of the Japanese Securities
and Exchange Law, to which Sony, as a Japanese public company, is subject.
Dollars in
Yen in millions millions
Year ended
Year ended March 31 March 31,
1999 2000 2001 2001
Sales and operating revenue:
Japan—
Customers . . . . . . . . . . . . . . . . . . . . . . . . . . . . . . ¥ 2,345,717 ¥2,560,839 ¥2,753,063 $ 22,024
Intersegment . . . . . . . . . . . . . . . . . . . . . . . . . . . 1,822,282 1,837,048 2,322,037 18,576
Total . . . . . . . . . . . . . . . . . . . . . . . . . . . . . . . . 4,167,999 4,397,887 5,075,100 40,600
U.S.A.—
Customers . . . . . . . . . . . . . . . . . . . . . . . . . . . . . . 2,232,816 2,082,505 2,315,985 18,528
Intersegment . . . . . . . . . . . . . . . . . . . . . . . . . . . 140,239 170,889 184,581 1,477
Total . . . . . . . . . . . . . . . . . . . . . . . . . . . . . . . . 2,373,055 2,253,394 2,500,566 20,005
Europe—
Customers . . . . . . . . . . . . . . . . . . . . . . . . . . . . . . 1,480,076 1,302,917 1,305,013 10,440
Intersegment . . . . . . . . . . . . . . . . . . . . . . . . . . . 65,466 48,751 48,991 392
Total . . . . . . . . . . . . . . . . . . . . . . . . . . . . . . . . 1,545,542 1,351,668 1,354,004 10,832
Other—
Customers . . . . . . . . . . . . . . . . . . . . . . . . . . . . . . 745,573 740,400 940,763 7,526
Intersegment . . . . . . . . . . . . . . . . . . . . . . . . . . . 724,240 718,321 852,648 6,821
Total . . . . . . . . . . . . . . . . . . . . . . . . . . . . . . . . 1,469,813 1,458,721 1,793,411 14,347
Elimination . . . . . . . . . . . . . . . . . . . . . . . . . . . . . . . (2,752,227) (2,775,009) (3,408,257) (27,266)
Consolidated total . . . . . . . . . . . . . . . . . . . . . . . . . . . . ¥ 6,804,182 ¥6,686,661 ¥7,314,824 $ 58,518
Operating income:
Japan . . . . . . . . . . . . . . . . . . . . . . . . . . . . . . . . . . . . ¥ 207,704 ¥84,630 ¥155,674 $ 1,245
U.S.A. . . . . . . . . . . . . . . . . . . . . . . . . . . . . . . . . . . . 77,728 97,295 23,131 185
Europe . . . . . . . . . . . . . . . . . . . . . . . . . . . . . . . . . . . 81,013 51,218 11,641 93
Other . . . . . . . . . . . . . . . . . . . . . . . . . . . . . . . . . . . . 46,627 73,249 71,059 569
Corporate and elimination . . . . . . . . . . . . . . . . . . . (75,011) (83,188) (36,159) (289)
Consolidated total . . . . . . . . . . . . . . . . . . . . . . . . . . . . ¥ 338,061 ¥223,204 ¥225,346 $ 1,803