Sysco 2013 Annual Report Download - page 13
Download and view the complete annual report
Please find page 13 of the 2013 Sysco annual report below. You can navigate through the pages in the report by either clicking on the pages listed below, or by using the keyword search tool below to find specific information within the annual report.-
 1
1 -
2
-
 3
3 -
 4
4 -
 5
5 -
 6
6 -
 7
7 -
 8
8 -
 9
9 -
 10
10 -
 11
11 -
 12
12 -
 13
13 -
 14
14 -
 15
15 -
 16
16 -
 17
17 -
 18
18 -
 19
19 -
 20
20 -
 21
21 -
 22
22 -
 23
23 -
24
-
25
-
26
-
27
-
28
-
29
-
30
-
31
-
32
-
33
-
34
-
35
-
36
-
37
-
38
-
39
-
40
-
41
-
42
-
43
-
44
-
45
-
46
-
47
-
48
-
49
-
50
-
51
-
52
-
53
-
54
-
55
-
56
-
57
-
58
-
59
-
60
-
61
-
62
-
63
-
64
-
65
-
66
-
67
-
68
-
69
-
70
-
71
-
72
-
73
-
74
-
75
-
76
-
77
-
78
-
79
-
80
-
81
-
82
-
83
-
84
-
85
-
86
-
87
-
88
-
89
-
90
-
91
-
92
-
93
-
94
-
95
-
96
-
97
-
98
-
99
-
100
-
101
 |
 |

SYSCO CORPORATION-Form10-K2
PARTI
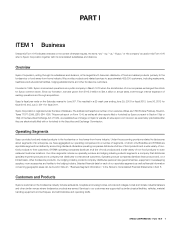
ITEM1Business
The products we distribute include:
•a full line of frozen foods, such as meats, seafood, fully prepared entrees, fruits, vegetables and desserts;
•a full line of canned and dry foods;
•fresh meats and seafood;
•dairy products;
•beverage products;
•imported specialties; and
•fresh produce.
We also supply a wide variety of non-food items, including:
•paper products such as disposable napkins, plates and cups;
•tableware such as china and silverware;
•cookware such as pots, pans and utensils;
•restaurant and kitchen equipment and supplies; and
•cleaning supplies.
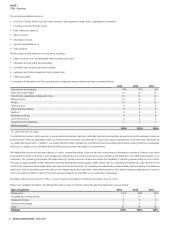
A comparison of the sales mix in the principal product categories during the last three years is presented below:
2013 2012 2011
Canned and dry products 19% 19% 19%
Fresh and frozen meats 19 19 18
Frozen fruits, vegetables, bakery and other 14 14 14
Dairy products 10 10 11
Poultry 10 10 10
Fresh produce 8 8 8
Paper and disposables 8 8 8
Seafood 5 5 5
Beverage products 4 4 4
Janitorial products 2 2 2
Equipment and smallwares 1 1 1
Medical supplies(1) - - -
100% 100% 100%
(1) Sales are less than 1% of total.
Our distribution centers, which we refer to as operating companies, distribute nationally-branded merchandise, as well as products packaged under our
private brands. Products packaged under our private brands have been manufactured for Sysco according to speci cations that have been developed by
our quality assurance team. In addition, our quality assurance team certi es the manufacturing and processing plants where these products are packaged,
enforces our quality control standards and identi es supply sources that satisfy our requirements.
We believe that prompt and accurate delivery of orders, competitive pricing, close contact with customers and the ability to provide a full array of products
and services to assist customers in their foodservice operations are of primary importance in the marketing and distribution of foodservice products to our
customers. Our operating companies offer daily delivery to certain customer locations and have the capability of delivering special orders on short notice.
Through our approximately12,600 sales and marketing representatives and support staff of Sysco and our operating companies, we stay informed of the
needs of our customers and acquaint them with new products and services. Our operating companies also provide ancillary services relating to foodservice
distribution, such as providing customers with product usage reports and other data, menu-planning advice, food safety training and assistance in inventory
control, as well as access to various third party services designed to add value to our customers’ businesses.
No single customer accounted for 10% or more of Sysco’s total sales for the scal year ended June29,2013.
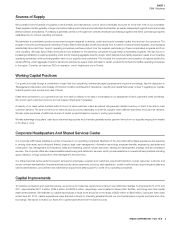
Based upon available information, we estimate that sales by type of customer during the past three scal years were as follows:
Type of Customer 2013 2012 2011
Restaurants 61% 63% 62%
Hospitals and nursing homes 9 10 11
Hotels and motels 5 6 6
Schools and colleges 5 5 5
Other 20 16 16
TOTALS 100% 100% 100%