Sysco 2013 Annual Report Download - page 40
Download and view the complete annual report
Please find page 40 of the 2013 Sysco annual report below. You can navigate through the pages in the report by either clicking on the pages listed below, or by using the keyword search tool below to find specific information within the annual report.-
 1
1 -
2
-
3
-
4
-
5
-
6
-
7
-
8
-
9
-
10
-
11
-
12
-
13
-
14
-
15
-
16
-
17
-
18
-
19
-
20
-
21
-
22
-
23
-
24
-
25
-
26
-
27
-
28
-
29
-
 30
30 -
 31
31 -
 32
32 -
 33
33 -
 34
34 -
 35
35 -
 36
36 -
 37
37 -
 38
38 -
 39
39 -
 40
40 -
 41
41 -
 42
42 -
 43
43 -
 44
44 -
 45
45 -
 46
46 -
 47
47 -
 48
48 -
 49
49 -
 50
50 -
51
-
52
-
53
-
54
-
55
-
56
-
57
-
58
-
59
-
60
-
61
-
62
-
63
-
64
-
65
-
66
-
67
-
68
-
69
-
70
-
71
-
72
-
73
-
74
-
75
-
76
-
77
-
78
-
79
-
80
-
81
-
82
-
83
-
84
-
85
-
86
-
87
-
88
-
89
-
90
-
91
-
92
-
93
-
94
-
95
-
96
-
97
-
98
-
99
-
100
-
101
 |
 |
SYSCO CORPORATION-Form10-K 29
PARTII
ITEM7Management’s Discussion and Analysis ofFinancial Condition and Results of Operations
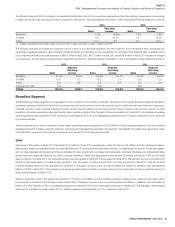
SYGMA Segment
SYGMA operating companies distribute a full line of food products and a wide variety of non-food products to certain chain restaurant customer locations.
SYGMA operations have traditionally had lower operating income as a percentage of sales than Sysco’s other segments. This segment of the foodservice
industry has generally been characterized by lower overall operating margins as the volume that these customers command allows them to negotiate for
reduced margins. These operations service chain restaurants through contractual agreements that are typically structured on a fee per case delivered basis.
Sales
Sales were 0.8% greater in scal 2013 than in scal 2012. The increase was primarily due to product cost in ation and the resulting increase in selling
prices, partially offset by case volume declines. Case volumes were challenged from low levels of growth from existing customers and from lost customers.
While SYGMA has experienced some success in replacing lost business with new customers, it has not been enough to signi cantly overcome the factors
noted above. We believe SYGMA’s sales growth prospects are better in scal 2014 as compared to scal 2013.
Sales were 7.4% greater in scal 2012 than in scal 2011. The increase in sales was primarily due to product cost in ation and the resulting increase in
selling prices. Sales to new customers also contributed to the increase.
One chain restaurant customer (The Wendy’s Company) accounted for approximately 25% of the SYGMA segment sales for the scal year ended
June29,2013. SYGMA maintains multiple regional contracts with varied expiration dates with this customer. While the loss of this customer would have
a material adverse effect on SYGMA, we do not believe that the loss of this customer would have a material adverse effect on Sysco as a whole.
Operating Income
Operating income decreased by 14.7% in scal 2013 from scal 2012. Gross pro t dollars decreased 0.9% while operating expenses increased 1.2% in
scal 2013 over scal 2012. These gross pro t results largely re ect the sluggish sales environment. Operating expenses increased in scal 2013 largely
due to increased delivery costs including pay-related expenses. Our enhanced de ned contribution plan became effective January1,2013 and contributed
to the increase in pay-related expense.
Operating income decreased $1.2million in 2012 from the prior year due to rising operating expenses. Gross pro t dollars increased 4.3% while operating
expenses increased 5.3% in scal 2012 from scal 2011. Contributing to the gross pro t increase in scal 2012 were increased sales and an increase of
approximately $8.3million in the fuel surcharges charged to customers in scal 2012 from prior year due to higher fuel prices in scal 2012. The increase
in operating expenses for scal 2012 was largely driven by increased fuel costs. Fuel costs in scal 2012 were $11.3million greater than the prior year.
Assuming that fuel prices do not signi cantly rise above recent levels during scal 2013, we expect fuel costs and fuel surcharges for our SYGMA segment
not to uctuate signi cantly as compared to scal 2012.
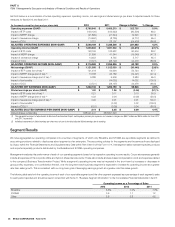
Other Segment
“Other” nancial information is attributable to our other operating segments, including our specialty produce and lodging industry products segments, a
company that distributes specialty imported products and a company that distributes to international customers. These operating segments are discussed
on an aggregate basis as they do not represent reportable segments under segment accounting literature.
On an aggregate basis, our “Other” segment has had a lower operating income as a percentage of sales than Sysco’s Broadline segment. Sysco has
acquired the operating companies within these segments in relatively recent years. These operations generally operate in a niche within the foodservice
industry except for our lodging industry supply company. Each individual operation is also generally smaller in sales and scope than an average Broadline
operation and each of these operating segments is considerably smaller in sales and overall scope than the Broadline segment. In scal 2013, in the
aggregate, the “Other” segment represented approximately 6.2% of Sysco’s overall sales and 3.9% of the aggregate operating income of Sysco’s segments,
which excludes corporate expenses.
Operating income increased 8.3% for scal 2013 over scal 2012. The increase in operating income was primarily driven by earnings from our lodging
industry products segment, our specialty import business, that was acquired in the third quarter of scal 2012, and our company that distributes to
international customers. All businesses in this segment experienced increased operating income which was partially offset by charges in our specialty produce
companies which incurred facility closing costs of $2.6million in scal 2013. An additional item partially offsetting the increase in operating income was an
increase in retirement-related expense for these companies. Our enhanced de ned contribution plan became effective January1,2013 and contributed
to increased expense at these companies.
Operating income decreased9.2% for scal 2012 from scal 2011. The decrease in operating income was caused partially due to increased expenses in
our specialty produce segment.