Sysco 2013 Annual Report Download - page 37
Download and view the complete annual report
Please find page 37 of the 2013 Sysco annual report below. You can navigate through the pages in the report by either clicking on the pages listed below, or by using the keyword search tool below to find specific information within the annual report.-
 1
1 -
2
-
3
-
4
-
5
-
6
-
7
-
8
-
9
-
10
-
11
-
12
-
13
-
14
-
15
-
16
-
17
-
18
-
19
-
20
-
21
-
22
-
23
-
24
-
25
-
26
-
 27
27 -
 28
28 -
 29
29 -
 30
30 -
 31
31 -
 32
32 -
 33
33 -
 34
34 -
 35
35 -
 36
36 -
 37
37 -
 38
38 -
 39
39 -
 40
40 -
 41
41 -
 42
42 -
 43
43 -
 44
44 -
 45
45 -
 46
46 -
 47
47 -
48
-
49
-
50
-
51
-
52
-
53
-
54
-
55
-
56
-
57
-
58
-
59
-
60
-
61
-
62
-
63
-
64
-
65
-
66
-
67
-
68
-
69
-
70
-
71
-
72
-
73
-
74
-
75
-
76
-
77
-
78
-
79
-
80
-
81
-
82
-
83
-
84
-
85
-
86
-
87
-
88
-
89
-
90
-
91
-
92
-
93
-
94
-
95
-
96
-
97
-
98
-
99
-
100
-
101
 |
 |

SYSCO CORPORATION-Form10-K26
PARTII
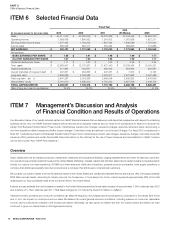
ITEM7Management’s Discussion and Analysis ofFinancial Condition and Results of Operations
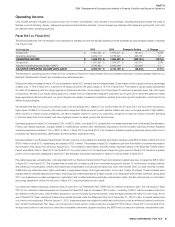
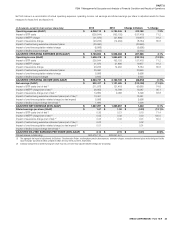
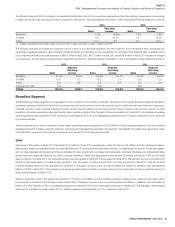
Set forth below is a reconciliation of actual operating expenses, operating income, net earnings and diluted earnings per share to adjusted results for these
measures for scal 2012 and scal 2011:
(Inthousands, except for share and per share data)
2012 2011 Change in Dollars % Change
Operating expenses (GAAP) $ 5,785,945 $ 5,463,210 $ 322,735 5.9%
Impact of BTP costs (193,126) (102,622) (90,504) 88.2
Impact of MEPP charge (21,899) (41,544) 19,645 (47.3)
Impact of severance charge (14,452) (8,735) (5,717) 65.4
Impact of COLI 3,721 28,197 (24,476) (86.8)
ADJUSTED OPERATING EXPENSES (NON-GAAP) $ 5,560,189 $ 5,338,506 $ 221,683 4.2%
Operating Income (GAAP) $ 1,890,632 $ 1,931,502 $ (40,870) (2.1)%
Impact of BTP costs 193,126 102,622 90,504 88.2
Impact of MEPP charge 21,899 41,544 (19,645) (47.3)
Impact of severance charge 14,452 8,735 5,717 65.4
Impact of COLI (3,721) (28,197) 24,476 (86.8)
ADJUSTED OPERATING INCOME (NON-GAAP) $ 2,116,388 $ 2,056,206 $ 60,182 2.9%
Net earnings (GAAP) $ 1,121,585 $ 1,152,030 $ (30,445) (2.6)%
Impact of BTP costs (net of tax)(1) 121,418 64,694 56,724 87.7
Impact of MEPP charge (net of tax)(1) 13,768 26,189 (12,421) (47.4)
Impact of severance charge (net of tax)(1) 9,086 5,506 3,580 65.0
Impact of tax bene ts - (14,032) 14,032 (100.0)
Impact of COLI (3,721) (28,197) 24,476 (86.8)
ADJUSTED NET EARNINGS (NON-GAAP) $ 1,262,136 $ 1,206,190 $ 55,946 4.6%
Diluted earnings per share (GAAP) $ 1.90 $ 1.96 $ (0.06) (3.1)%
Impact of BTP costs (net of tax)(2) 0.21 0.11 0.10 90.9
Impact of MEPP charge (net of tax)(2) 0.02 0.04 (0.02) (50.0)
Impact of severance charge (net of tax)(2) 0.02 0.01 0.01 100.0
Impact of tax bene ts(2) - (0.02) 0.02 (100.0)
Impact of COLI(2) (0.01) (0.05) 0.04 (80.0)
ADJUSTED DILUTED EARNINGS PER SHARE (NON-GAAP) $ 2.14 $ 2.05 $ 0.09 4.4%
Dilutedshares outstanding 588,991,441 588,691,546
(1) The aggregate tax impact of adjustments for Business Transformation Project, multiemployer pension plan expenses and severance charges was $85.2million and $56.5million for fiscal 2012
and 2011, respectively.
(2) Individual components of diluted earnings per share may not sum to the total adjusted diluted earnings due to rounding.
Segment Results
We have aggregated our operating companies into a number of segments, of which only Broadline and SYGMA are reportable segments as de ned in
accounting provisions related to disclosures about segments of an enterprise. The accounting policies for the segments are the same as those disclosed
by Sysco within the Financial Statements and Supplementary Data within PartII Item8 of this Form10-K. Intersegment sales represent specialty produce
and imported specialty products distributed by the Broadline and SYGMA operating companies.
Management evaluates the performance of each of our operating segments based on its respective operating income results. Corporate expenses generally
include all expenses of the corporate of ce and Sysco’s shared service center. These also include all share-based compensation costs and expenses related
to the company’s Business Transformation Project. While a segment’s operating income may be impacted in the short-term by increases or decreases in
gross pro ts, expenses, or a combination thereof, over the long-term each business segment is expected to increase its operating income at a greater
rate than sales growth. This is consistent with our long-term goal of leveraging earnings growth at a greater rate than sales growth.
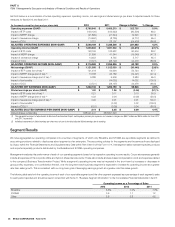
The following table sets forth the operating income of each of our reportable segments and the other segment expressed as a percentage of each segment’s sales
for each period reported and should be read in conjunction with Note21, “Business Segment Information” to the Consolidated Financial Statements in Item8:
Operating Income as a Percentage of Sales
2013 2012 2011
Broadline 6.6% 7.0% 7.3%
SYGMA 0.9 1.1 1.2
Other 3.6 3.8 4.5