Sysco 2013 Annual Report Download - page 43
Download and view the complete annual report
Please find page 43 of the 2013 Sysco annual report below. You can navigate through the pages in the report by either clicking on the pages listed below, or by using the keyword search tool below to find specific information within the annual report.-
 1
1 -
2
-
3
-
4
-
5
-
6
-
7
-
8
-
9
-
10
-
11
-
12
-
13
-
14
-
15
-
16
-
17
-
18
-
19
-
20
-
21
-
22
-
23
-
24
-
25
-
26
-
27
-
28
-
29
-
30
-
31
-
32
-
 33
33 -
 34
34 -
 35
35 -
 36
36 -
 37
37 -
 38
38 -
 39
39 -
 40
40 -
 41
41 -
 42
42 -
 43
43 -
 44
44 -
 45
45 -
 46
46 -
 47
47 -
 48
48 -
 49
49 -
 50
50 -
 51
51 -
 52
52 -
 53
53 -
54
-
55
-
56
-
57
-
58
-
59
-
60
-
61
-
62
-
63
-
64
-
65
-
66
-
67
-
68
-
69
-
70
-
71
-
72
-
73
-
74
-
75
-
76
-
77
-
78
-
79
-
80
-
81
-
82
-
83
-
84
-
85
-
86
-
87
-
88
-
89
-
90
-
91
-
92
-
93
-
94
-
95
-
96
-
97
-
98
-
99
-
100
-
101
 |
 |
SYSCO CORPORATION-Form10-K32
PARTII
ITEM7Management’s Discussion and Analysis ofFinancial Condition and Results of Operations
Investing Activities
Fiscal 2013 capital expenditures included:
• eet replacements;
•construction of a fold-out facility in southern California;
•
replacement or signi cant expansion of facilities in Atlanta, Georgia; British Columbia, Canada; Boston, Massachusetts and Columbia, South Carolina; and
•investments in technology.
Fiscal 2012 capital expenditures included:
•
replacement or signi cant expansion of facilities in San Diego, California; Boston, Massachusetts; Lincoln, Nebraska; Syracuse, NewYork and central Texas;
•construction of fold-out facilities in southern California and Long Island, NewYork;
•the continued remodeling of our shared services facility purchased in scal 2010;
• eet replacements; and
•investments in technology including our Business Transformation Project.
Fiscal 2011 capital expenditures included:
•investments in technology including our Business Transformation Project;
• eet replacements;
•replacement or signi cant expansion of facilities in Philadelphia, Pennsylvania and central Texas;
•the purchase of land for a fold-out facility in southern California; and
•the remodeling of our shared services facility purchased in scal 2010.
Capital expenditures in scal 2013 decreased by $272.6million from scal 2012 primarily due to less investment in technology in scal 2013 related to our
Business Transformation Project due to the initiation of the project’s deployment phase in August2012. Capital expenditures in scal 2012 increased by
$148.1million over scal 2011 primarily due to a greater number of new facilities and expansion projects underway in scal 2012 as compared to scal 2011.
Capital expenditures in scal 2013,2012 and 2011 for our Business Transformation Project were $20.0million, $146.2million and $195.8million, respectively.
We expect total capital expenditures in scal 2014 to be in the range of $550million to $600million. Fiscal 2014 expenditures will include facility, eet and
other equipment replacements and expansions; new facility construction, including fold-out facilities; and investments in technology.
During scal 2013, in the aggregate, the company paid cash of $397.4million for operations acquired during scal 2013 and for contingent consideration
related to operations acquired in previous scal years. During scal 2013, we acquired for cash foodservice operations in Nassau, Bahamas; San Francisco,
California; San Jose, California; Stockton, California; Ontario, Canada; Quebec, Canada; Orlando, Florida; Dublin, Ireland; St. Cloud, Minnesota; Co. Down,
Northern Ireland; Greenville, Ohio and Houston, Texas.
During scal 2012, in the aggregate, the company paid cash of $110.6million for operations acquired during scal 2012 and for contingent consideration
related to operations acquired in previous scal years. During scal 2012, we acquired for cash broadline foodservice operations in Sacramento, California;
Quebec, Canada; New Haven, Connecticut; Grand Rapids, Michigan; Minneapolis, Minnesota; Columbia, South Carolina and Spokane, Washington. In
addition, Sysco acquired for cash a company that distributes specialty imported products headquartered in Chicago, Illinois.
During scal 2011, in the aggregate, the company paid cash of $101.1million for operations acquired during scal 2011 and for contingent consideration
related to operations acquired in previous scal years. During scal 2011, we acquired for cash broadline foodservice operations in central California; Los
Angeles, California; Ontario, Canada; Lincoln, Nebraska; and Trenton, New Jersey.
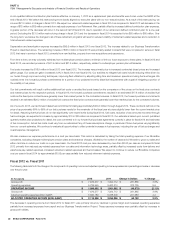
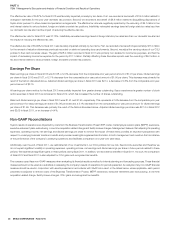
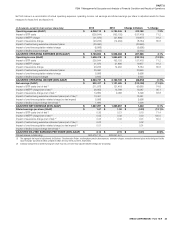
Free Cash Flow
Free cash ow represents net cash provided from operating activities less purchases of plant and equipment plus proceeds from sales of plant and
equipment. Sysco considers free cash ow to be a non-GAAP liquidity measure that provides useful information to management and investors about the
amount of cash generated by the business after the purchases of buildings, eet, equipment and technology, which may potentially be used to pay for,
among other things, strategic uses of cash including dividend payments, share repurchases and acquisitions. We do not mean to imply that free cash ow
is necessarily available for discretionary expenditures, however, as it may be necessary that we use it to make mandatory debt service or other payments. As
a result of reduced capital spending and increased cash provided by operating activities, free cash ow for scal 2013 increased 61.7%, or $387.4million,
to $1.0billion as compared to scal 2012. Increased cash provided by operating activities, partially offset by increased capital spending, resulted in free
cash ow for scal 2012 increasing 32.4%, or $153.7million, to $627.9million as compared to scal 2011. We expect the growth rate in free cash ow
for scal 2014 will not be as signi cant as the growth rate experienced in scal 2013.